
| TTN version: | TTNv3 |
| System: | 64-bit |
| Last updated: | June 28, 2024 |
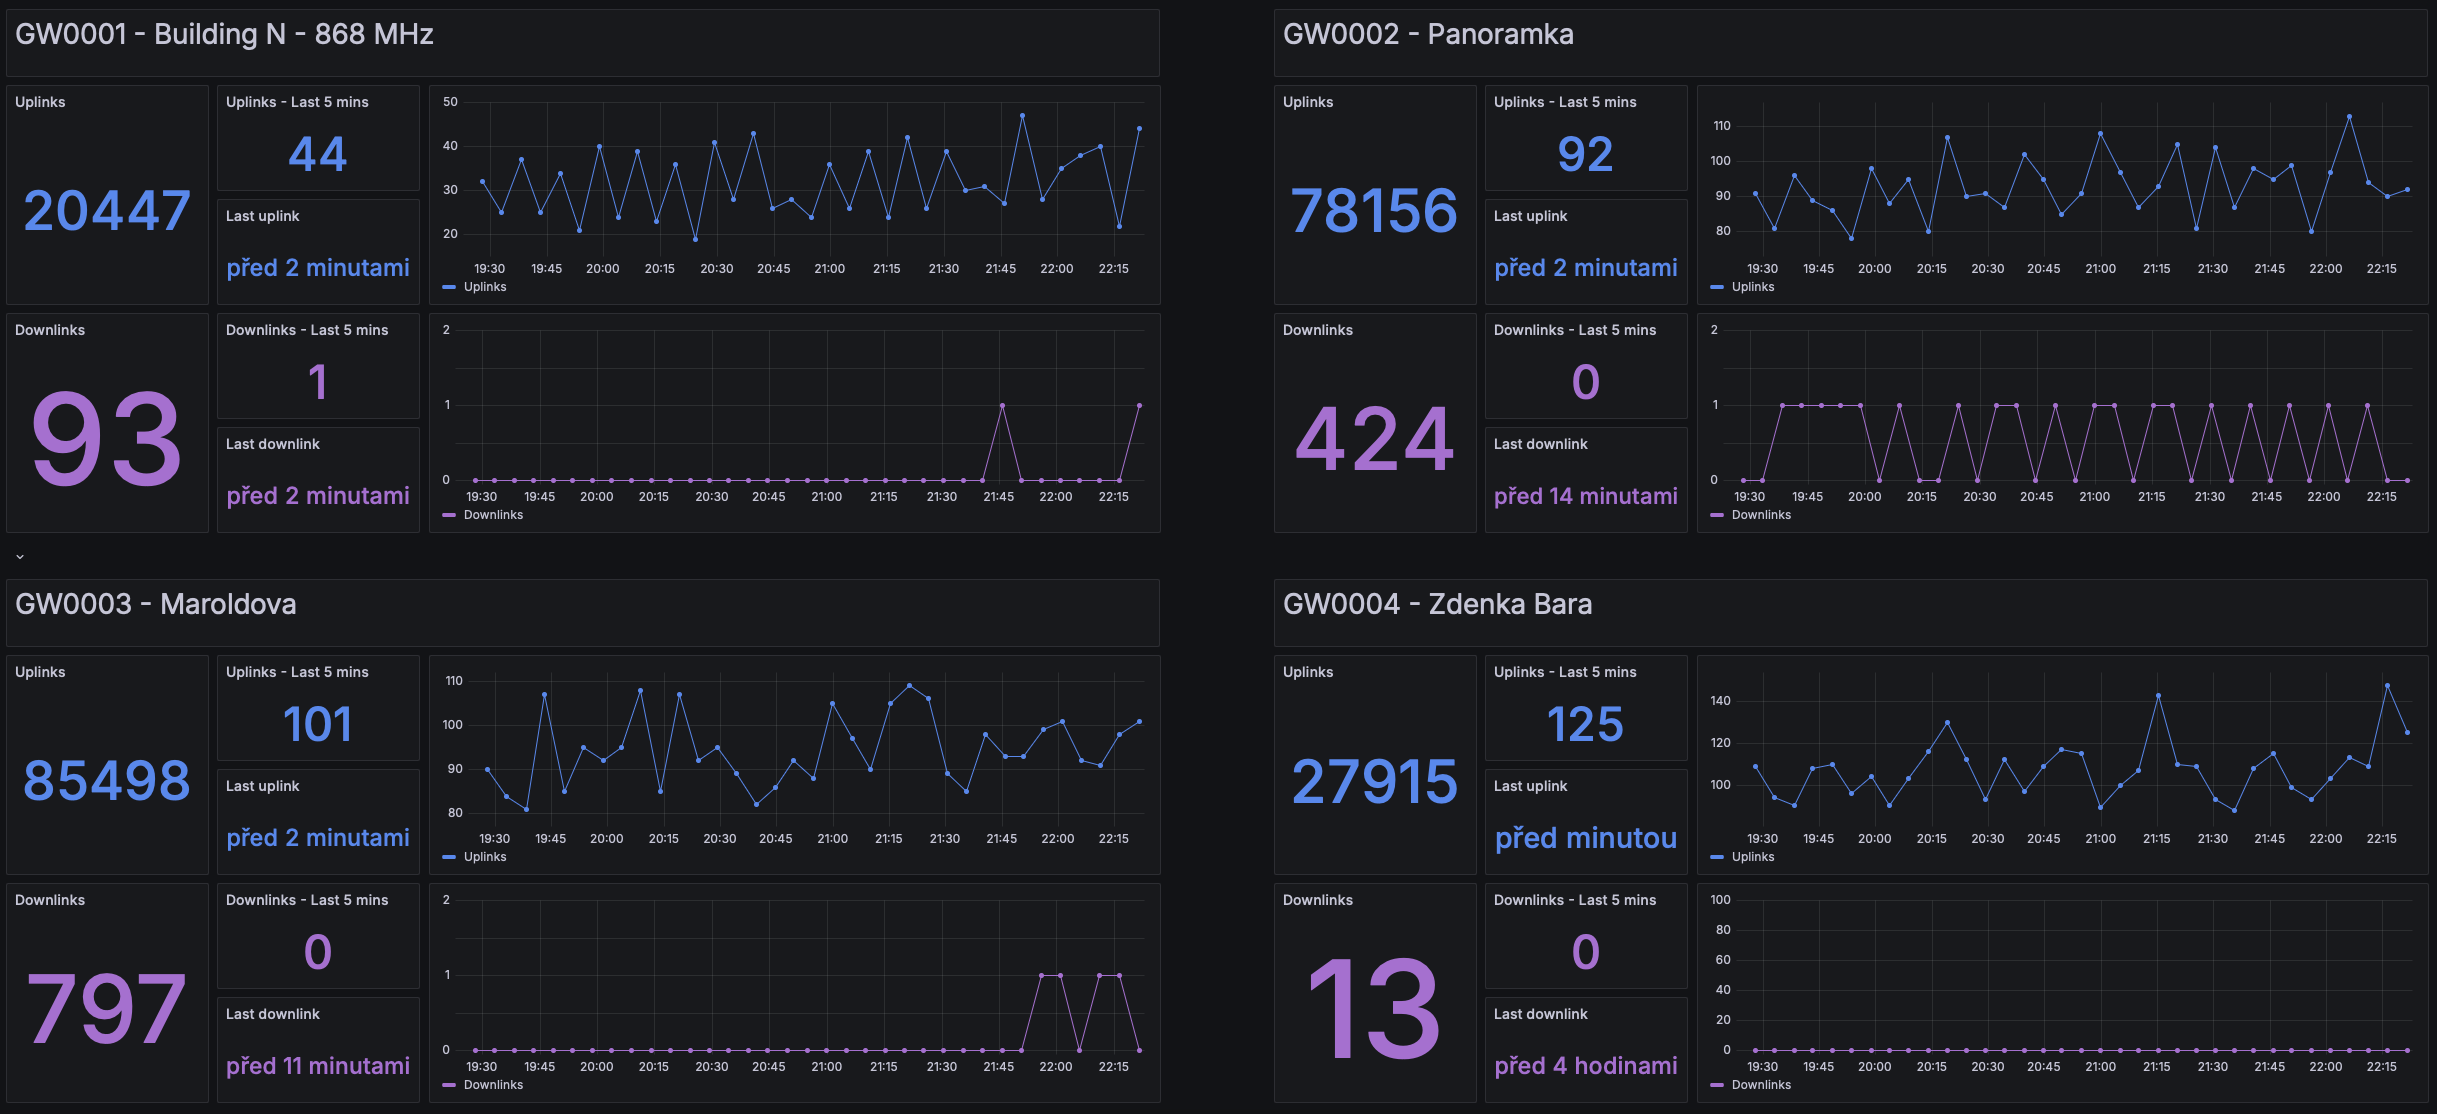
For gateways monitoring, we use an open-source time series database InfluxDB and an open-source analytical and interactive visualization web application Grafana. Gateway data is loaded from The Things Stack using our TGM. The TGM makes a GET requests, parses the data received in the response, and then stores the data (number of uplinks and downlinks, times – last uplink received at, last downlink received at and last status received at) in the InfluxDB database.
Prepare
- Raspberry Pi 4/5 or Linux server
- The Things Stack with active gateways
Raspberry Pi OS setup and Docker installation
Raspberry Pi OS setup
- From https://www.raspberrypi.com/software/ download Raspberry Pi Imager and install it.
- Insert the microSD card into the computer.
- Run Raspberry Pi Imager.
- Click on CHOOSE OS.
- Click on Raspberry Pi OS (other).
- Click on Raspberry Pi OS Lite (64-bit).
- Click on CHOOSE STORAGE.
- Select the inserted microSD card on which you want to install Raspberry Pi OS.
- Click on Next.
- Would you like to apply OS customisation settings? – EDIT SETTINGS.
- Set hostname.
- Set username and password. (we recommend a 17-digit password containing lower and upper case letters, numbers and symbols)
- If you will use WiFi – Configure wireless LAN. (optional)
- Set locale settings.
- Click on tab SERVICES.
- If you will be connecting remotely via SSH – Enable SSH – Use password authentication. (optional)
- Click on SAVE.
- Click on YES.
- Click on YES.
- Click on CONTINUE.
- Insert the microSD card into the Raspberry Pi.
- Turn on the Raspberry Pi.
Remote connection via SSH (optional)
- Connect to your router and find the IP address of your Raspberry Pi.
- From a Windows PC, you can connect using Command Prompt (CMD) or PuTTY.
- On Windows PC open Command Prompt (CMD).
- Type
ssh -p port username@IP_Address(for example: ssh -p 22 loravsb@192.168.1.120). - Type your password.
Post-installation steps
- Update, upgrade and reboot Raspberry Pi. This will ensure that any security vulnerabilities are patched:
$ sudo apt update
$ sudo apt full-upgrade
$ sudo reboot
- Connect again via SSH.
- Use a different port for SSH and disable root login. First, open the SSH configuration file with a text editor:
$ sudo nano /etc/ssh/sshd_config
- Locate the line with
Port 22and change it to the desired port number (for example, change the port to 2222). Locate the line withPermitRootLoginand change its value tono(this will disable root login via SSH):Port 2222 PermitRootLogin no - Save the changes and exit the text editor.
- Restart the SSH service to apply the changes:
$ sudo systemctl restart ssh
- Log out and connect again via SSH on the new port.
- Install and configure the built-in firewall, ufw, to limit incoming and outgoing network connections. In the
sudo ufw limit 2222/tcprule, change port 2222 to port you have chose for SSH above.$ sudo apt install ufw $ sudo ufw default deny incoming $ sudo ufw default deny outgoing $ sudo ufw limit 2222/tcp $ sudo ufw allow out 123/udp $ sudo ufw allow out to any port 53 $ sudo ufw allow out to any port 80 $ sudo ufw allow out to any port 443 $ sudo ufw enableNote: Firewall rules will have no effect on ports opened by Docker.
- Reboot Raspberry Pi:
$ sudo reboot
Docker
- Connect again via SSH.
- Install the latest Docker version using the convenience script provided by docker:
$ curl -fsSL https://get.docker.com -o get-docker.sh
$ sudo sh get-docker.sh
$ sudo groupadd docker
$ sudo usermod -aG docker $USER
$ newgrp docker
$ sudo systemctl enable docker.service
$ sudo systemctl enable containerd.service
For more information on Docker installation, see https://docs.docker.com/engine/install/.
TTS API key
- In TTS -> YourUsername -> Personal API keys click on + Add API key.
- Write something in the Name.
- Select Grant individual rights.
- Check List gateways the user is collaborator of.
- Click on button Create API key.
- Click the Copy to Clipboard button and save the key somewhere safe for later use.
- In the section below, you will use the API key.
Option 1: InfuxDB v1.8.10, Grafana and TGM 1 setup
If you want to deploy the new Grafana, InfluxDB v1.8.10 and TGM 1, follow the instructions in this section.
- Clone the repository with TGM 1 and go to the created directory:
$ git clone https://github.com/OndrejKnebl/tgm_1.git
$ cd tgm_1
- Create internal Docker networks:
$ sudo docker network create myNetworkIandG
$ sudo docker network create myNetworkIandM
- Run this command to edit the docker-compose.yml file:
$ sudo nano docker-compose.yml
- Copy and paste the API key you got previously saved to the TTN_PERSONAL_API_KEY variable.
- Replace the values of the following variables with your values and save the docker-compose.yml file:
INFLUXDB_DB,
INFLUXDB_ADMIN_USER,
INFLUXDB_ADMIN_PASSWORD,
INFLUXDB_WRITE_USER,
INFLUXDB_WRITE_USER_PASSWORD,
INFLUXDB_READ_USER,
INFLUXDB_READ_USER_PASSWORD,
DB_USERNAME,
DB_PASSWORD,
DB_NAME,
DB_MEASUREMENT
- Build the image:
$ sudo docker compose build
- Now, you can start it running in the background with the following command:
$ sudo docker compose up -d
Grafana setup
- Now you can visit your Grafana web application from a browser in your internal network at
http://IP_AddressOfServer:3000(for example 192.168.1.120:3000). - Log in with username admin and password admin.
- Change your Grafana account password.
- Click on Connections -> Data sources -> Add data source.
- Choose InfluxDB.
- Query Language = InfluxQL
- URL =
http://influxdb:8086 - Database = ttnGateways
- User = myNewReadUser
- Password = myNewReadUserPassword
- HTTP Method = GET
- Click on Save & test
- Continue with the “Grafana dashboard setup” section below.
Option 2: InfuxDB v2, Grafana and TGM 2 setup
If you want to deploy the new Grafana, InfluxDB v2 and TGM 2, follow the instructions in this section.
- Clone the repository with TGM 2 and go to the created directory:
$ git clone https://github.com/OndrejKnebl/tgm_2.git
$ cd tgm_2
- Create internal Docker networks:
$ sudo docker network create myNetworkIandG
$ sudo docker network create myNetworkIandM
- Build the image:
$ sudo docker compose build
- Now, you can start it running with the following command:
$ sudo docker compose up
- Now you can visit your InfluxDB web application from a browser in your internal network at
http://IP_AddressOfServer:8086(for example 192.168.1.120:8086). - Click on GET STARTED.
- Setup your Initial User – Username, Password, Organization and Bucket.
- Click on CONTINUE.
- Click on QUICK START.
- In the left menu, click Load data -> API Tokens -> + GENERATE API TOKEN -> Custom API Token.
- Write something to Description.
- Click on Buckets and check the Read box next to the previously created bucket.
- Click on GENERATE.
- Click on the COPY TO CLIPBOARD button and save the key somewhere safe for later use in Grafana.
- Click on cross button.
- Click on + GENERATE API TOKEN -> Custom API Token.
- Write something to Description.
- Click on Buckets and check the Write box next to the previously created bucket.
- Click on GENERATE.
- Click on the COPY TO CLIPBOARD button and save the key somewhere safe for later use in docker-compose.yml file for TGM.
- Click on cross button.
- Logout from your InfluxDB web application.
- In the terminal with container outputs running, press Ctrl+C.
- Run this command to edit the docker-compose.yml file:
$ sudo nano docker-compose.yml
- Copy and paste the TTN API key you got previously saved to the TTN_PERSONAL_API_KEY variable.
- Replace the values of the following variables with your values and save the docker-compose.yml file:
DB_WRITE_TOKEN,
DB_ORG,
DB_BUCKET
- Now, you can start it running in the background with the following command:
$ sudo docker compose up -d
- Continue with the “Grafana dashboard setup” section below.
Grafana setup
- Now you can visit your Grafana web application from a browser in your internal network at
http://IP_AddressOfServer:3000(for example 192.168.1.120:3000). - Log in with username admin and password admin.
- Change your Grafana account password.
- Click on Connections -> Data sources -> Add data source.
- Choose InfluxDB.
- Query Language = InfluxQL
- URL =
http://influxdb2:8086 - Database = myBucket
- User = myInitialUser
- Password = myReadToken
- HTTP Method = GET
- Click on Save & test
- Continue with the “Grafana dashboard setup” section below.
Grafana dashboard setup
- Click on Dashboards -> New -> New Dashboard.
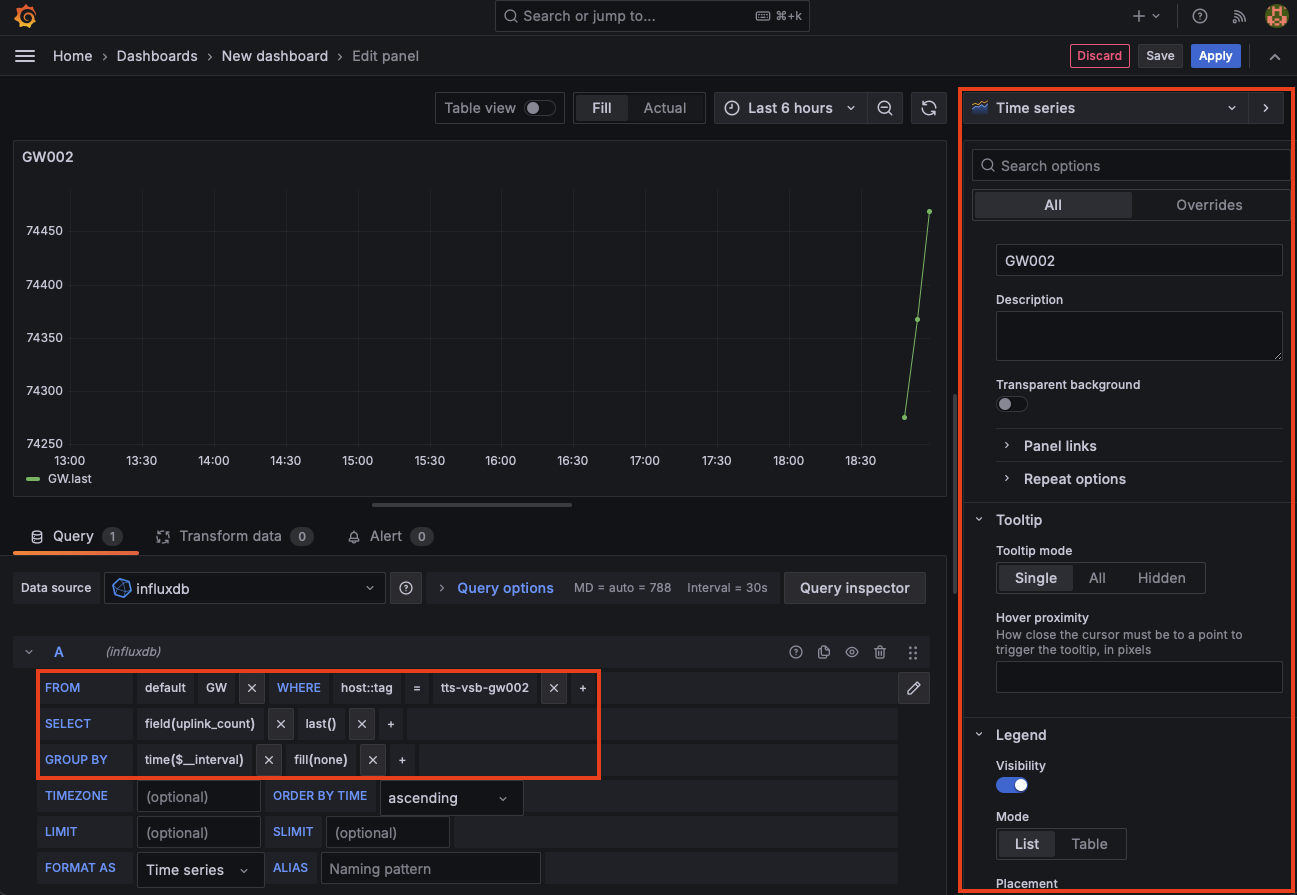
- Choose + Add visualization -> influxdb.
- In the FROM line click on select measurement and select GW (InfliuxDB v2 – your Bucket).
- Click on + and select host::tag.
- Click on select tag value and select your gateway.
- In the SELECT line click on value and select for example uplink_count.
- Then change mean() to last().
- In the GROUP BY line change fill(null) to fill(none).
- You can change the Type, Title, Unit, Display name, Color scheme and many more in the menu on the right.
- Next, click on Save.
- Continue like this for the other panels and gateways.
- If you want to display the increase in the number of Downlinks/Uplinks since the last data collection, it is necessary to write the query manually.
- In the settings of the newly added blank panel, press the pencil symbol and put the query with uplink or downlink count in the field.
- An example of creating a query to determine the difference is shown below:
SELECT difference_value
FROM (
SELECT difference(last("uplink_count")) AS difference_value
FROM "GW"
WHERE ("host"::tag = 'tts-vsb-gw002') AND $timeFilter
GROUP BY time($__interval) fill(none)
)
WHERE difference_value >= 0