
| TTN version: | TTNv3 |
| System: | 64-bit |
| Last updated: | January 5, 2024 |
For data storage and visualization, we use an open-source time series database InfluxDB and an open-source analytical and interactive visualization web application Grafana. Data from The Things Stack is sent via MQTT to the MQTT consumer Telegraf, which then stores the data in the InfluxDB database.
Prepare
- Raspberry Pi 3/4 or Linux server
- The Things Stack with active sensor (for example BME280)
OS/Server and Docker installation
This section describes two installation processes based on the operating system – Raspberry Pi OS and Ubuntu Server.
Raspberry Pi OS
Raspberry Pi OS setup
- From https://www.raspberrypi.com/software/ download Raspberry Pi Imager and install it.
- Insert the microSD card into the computer.
- Run Raspberry Pi Imager.
- Click on CHOOSE OS.
- Click on Raspberry Pi OS (other).
- Click on Raspberry Pi OS Lite (64-bit).
- Click on CHOOSE STORAGE.
- Select the inserted microSD card on which you want to install Raspberry Pi OS.
- Click on Next.
- Would you like to apply OS customisation settings? – EDIT SETTINGS.
- Set hostname.
- Set username and password. (we recommend a 17-digit password containing lower and upper case letters, numbers and symbols)
- If you will use WiFi – Configure wireless LAN. (optional)
- Set locale settings.
- Click on tab SERVICES.
- If you will be connecting remotely via SSH – Enable SSH – Use password authentication. (optional)
- Click on SAVE.
- Click on YES.
- Click on YES.
- Click on CONTINUE.
- Insert the microSD card into the Raspberry Pi.
- Turn on the Raspberry Pi.
Remote connection via SSH (optional)
- Connect to your router and find the IP address of your Raspberry Pi.
- From a Windows PC, you can connect using Command Prompt (CMD) or PuTTY.
- On Windows PC open Command Prompt (CMD).
- Type
ssh -p port username@IP_Address(for example: ssh -p 22 loravsb@192.168.1.120). - Type your password.
Post-installation steps
- Update, upgrade and reboot Raspberry Pi. This will ensure that any security vulnerabilities are patched:
$ sudo apt update
$ sudo apt full-upgrade
$ sudo reboot
- Connect again via SSH.
- Use a different port for SSH and disable root login. First, open the SSH configuration file with a text editor:
$ sudo nano /etc/ssh/sshd_config
- Locate the line with
Port 22and change it to the desired port number (for example, change the port to 2222). Locate the line withPermitRootLoginand change its value tono(this will disable root login via SSH):Port 2222 PermitRootLogin no - Save the changes and exit the text editor.
- Restart the SSH service to apply the changes:
$ sudo systemctl restart ssh
- Log out and connect again via SSH on the new port.
- Install and configure the built-in firewall, ufw, to limit incoming and outgoing network connections. In the
sudo ufw limit 2222/tcprule, change port 2222 to port you have chose for SSH above.$ sudo apt install ufw $ sudo ufw default deny incoming $ sudo ufw default deny outgoing $ sudo ufw limit 2222/tcp $ sudo ufw allow out 123/udp $ sudo ufw allow out to any port 53 $ sudo ufw allow out to any port 80 $ sudo ufw allow out to any port 443 $ sudo ufw enableNote: Firewall rules will have no effect on ports opened by Docker.
- Reboot Raspberry Pi:
$ sudo reboot
Docker
- Connect again via SSH.
- Install additional packages:
$ sudo apt install ca-certificates curl gnupg lsb-release
- Add Docker’s official GPG key:
$ sudo mkdir -p /etc/apt/keyrings
$ curl -fsSL https://download.docker.com/linux/debian/gpg | sudo gpg --dearmor -o /etc/apt/keyrings/docker.gpg
- Use the following command to set up the repository:
$ echo "deb [arch=$(dpkg --print-architecture) signed-by=/etc/apt/keyrings/docker.gpg] https://download.docker.com/linux/debian $(lsb_release -cs) stable" | sudo tee /etc/apt/sources.list.d/docker.list > /dev/null
- Update the apt package index:
$ sudo apt update
- Install the latest Docker version:
$ sudo apt-get install docker-ce docker-ce-cli containerd.io docker-compose-plugin
- Verify that the Docker Engine installation is successful by running the hello-world image:
$ sudo docker run hello-world
- Continue to the InfluxDB setup section below.
For more information on Docker installation, see https://docs.docker.com/engine/install/debian/.
Ubuntu Server
- From https://ubuntu.com/download/server download ISO image.
If the server’s operating system will run directly on the hardware, proceed as follows, otherwise skip these steps:
- Download Balena Etcher Portable from https://www.balena.io/etcher#download-etcher and run it.
- Click on Flash from file.
- Select the downloaded ISO Image.
- Insert the USB flash drive into the computer.
- Click on Select target.
- Select the USB flash drive.
- Click on Flash!
- Insert the USB flash drive into the server.
Ubuntu Server and Docker setup
- Boot from the USB flash drive / ISO image.
- Select Try or Install Ubuntu Server.
- Select Language.
- Choose Update to the new installer.
- Select keyboard layout.
- Choose the base for the installation – Ubuntu Server.
- Configure Network connections.
- Configure the proxy address or leave it blank.
- Configure Ubuntu archive mirror – default.
- Storage configuration – default.
- Profile setup – Enter username, password, …
- SSH Setup – Select Install OpenSSH server if you want to connect remotely. (optional)
- Features Server Snaps – Select a docker.
- Click on Reboot.
Remote connection via SSH (optional)
- Log in to the server.
- Type to the server’s terminal
ip a. - From a Windows PC, you can connect using Command Prompt (CMD) or PuTTY.
- On Windows PC open Command Prompt (CMD).
- Type
ssh -p port username@IP_Address(for example: ssh -p 22 loravsb@192.168.1.120). - Type your password.
Post-installation steps
- Update, upgrade and reboot server. This will ensure that any security vulnerabilities are patched:
$ sudo apt update
$ sudo apt full-upgrade
$ sudo reboot
- Connect again via SSH.
- Use a different port for SSH and disable root login. First, open the SSH configuration file with a text editor:
$ sudo nano /etc/ssh/sshd_config
- Locate the line with
Port 22and change it to the desired port number (for example, change the port to 2222). Locate the line withPermitRootLoginand change its value tono(this will disable root login via SSH):Port 2222 PermitRootLogin no - Save the changes and exit the text editor.
- Restart the SSH service to apply the changes:
$ sudo systemctl restart ssh
- Log out and connect again via SSH on the new port.
- Install and configure the built-in firewall, ufw, to limit incoming and outgoing network connections.
- Reboot server:
$ sudo reboot
Docker test
- Verify that the Docker Engine installation is successful by running the hello-world image:
$ sudo docker run hello-world
InfluxDB setup
- Create internal Docker networks:
$ sudo docker network create myNetworkIandG
$ sudo docker network create myNetworkIandT
- Run this commands to run InfluxDB 1.8.10 and connect the container to second network:
$ sudo docker run -d --restart always --name=influxdb --network myNetworkIandG -v influxdb:/var/lib/influxdb influxdb:1.8.10
$ sudo docker network connect myNetworkIandT influxdb
- Connect to InfluxDB container:
$ sudo docker container exec -it influxdb /bin/sh
- Connect to InfluxDB using influx CLI, create an admin and two users, create a database and give the first user read permission (for Grafana) and the second user write permission (for Telegraf) to the created database:
# influx
> CREATE USER myNewAdmin WITH PASSWORD 'myAdminPassword' WITH ALL PRIVILEGES
> CREATE USER myNewUser WITH PASSWORD 'myUserPassword'
> CREATE USER myNewTelegrafUser WITH PASSWORD 'myUserTelegrafPassword'
> CREATE DATABASE ttsDatabase
> GRANT READ ON "ttsDatabase" TO "myNewUser"
> GRANT WRITE ON "ttsDatabase" TO "myNewTelegrafUser"
> exit
- Enable authentication by adding the following [http] section to the influxdb.conf file:
# cd etc/influxdb
# cat <<EOT >> influxdb.conf
>
>[http]
>  enabled = true
>  auth-enabled = true
>EOT
# exit
- Restart the influxdb container:
$ sudo docker restart influxdb
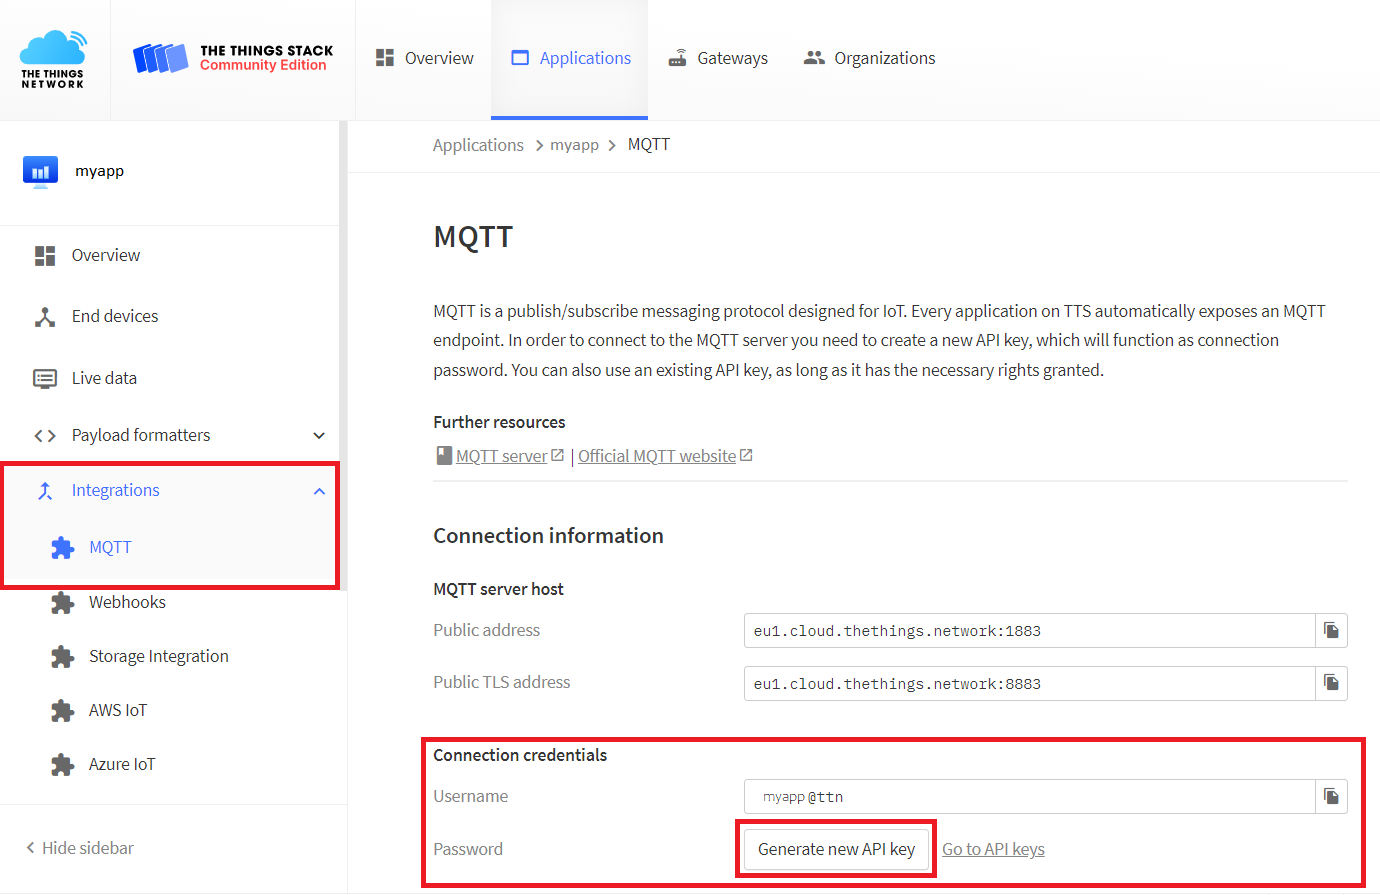
TTS MQTT Integration
- In TTS -> Applications -> YourAppName -> Integrations -> MQTT click on Generate new API key.
- In the Telegram section below, you will use the Connection credentials to connect to the TTS MQTT server.
Telegraf
- Run this command to create and edit the telegraf.conf file:
$ nano telegraf.conf
- Copy and paste the configuration below into your telegraf.conf file. Then in the [[inputs.mqtt_consumer]] section, enter the username and the generated API key. Next, in the [[outputs.influxdb]] section, edit the database, username and password that you created in the InfluxDB setup section above.
[agent] interval = "5s" round_interval = true metric_batch_size = 1000 metric_buffer_limit = 10000 collection_jitter = "5s" flush_interval = "10s" flush_jitter = "5s" [[inputs.mqtt_consumer]] name_override = "tts" servers = ["tcp://eu1.cloud.thethings.network:1883"] connection_timeout = "30s" topics = ["v3/+/devices/#"] username = "THING_USERNAME" password = "THING_API_KEY" data_format = "json" [[outputs.influxdb]] database = "ttsDatabase" urls = ["http://influxdb:8086"] username = "myNewTelegrafUser" password = "myUserTelegrafPassword" - Run this commands to run Telegraf:
$ sudo docker run -d --restart always --name=telegraf --network myNetworkIandT -v $PWD/telegraf.conf:/etc/telegraf/telegraf.conf:ro telegraf
For more information on Telegraf installation, see https://hub.docker.com/_/telegraf.
Grafana
Grafana setup
- Navigate to the /home/username directory.
- Create a my-grafana-plugins folder:
$ mkdir my-grafana-plugins
- Run this command to run Grafana:
$ sudo docker run -d --restart always --name=grafana --network myNetworkIandG -p 3000:3000 -v "$(pwd)"/my-grafana-plugins:/var/lib/grafana/plugins grafana/grafana
- Now you can visit your Grafana web application from a browser in your internal network at
http://IP_AddressOfServer:3000(for example 192.168.1.120:3000). - Log in with username admin and password admin.
- Change your Grafana account password.
- Click on Configuration -> Data sources -> Add data source.
- Choose InfluxDB.
- Query Language = InfluxQL
- URL =
http://influxdb:8086 - Database = ttsDatabase
- User = myNewUserFromInfluxDB
- Password = myUserPasswordFromInfluxDB
- HTTP Method = GET
- Click on Save & test
For more information on Grafana installation, see https://hub.docker.com/r/grafana/grafana.
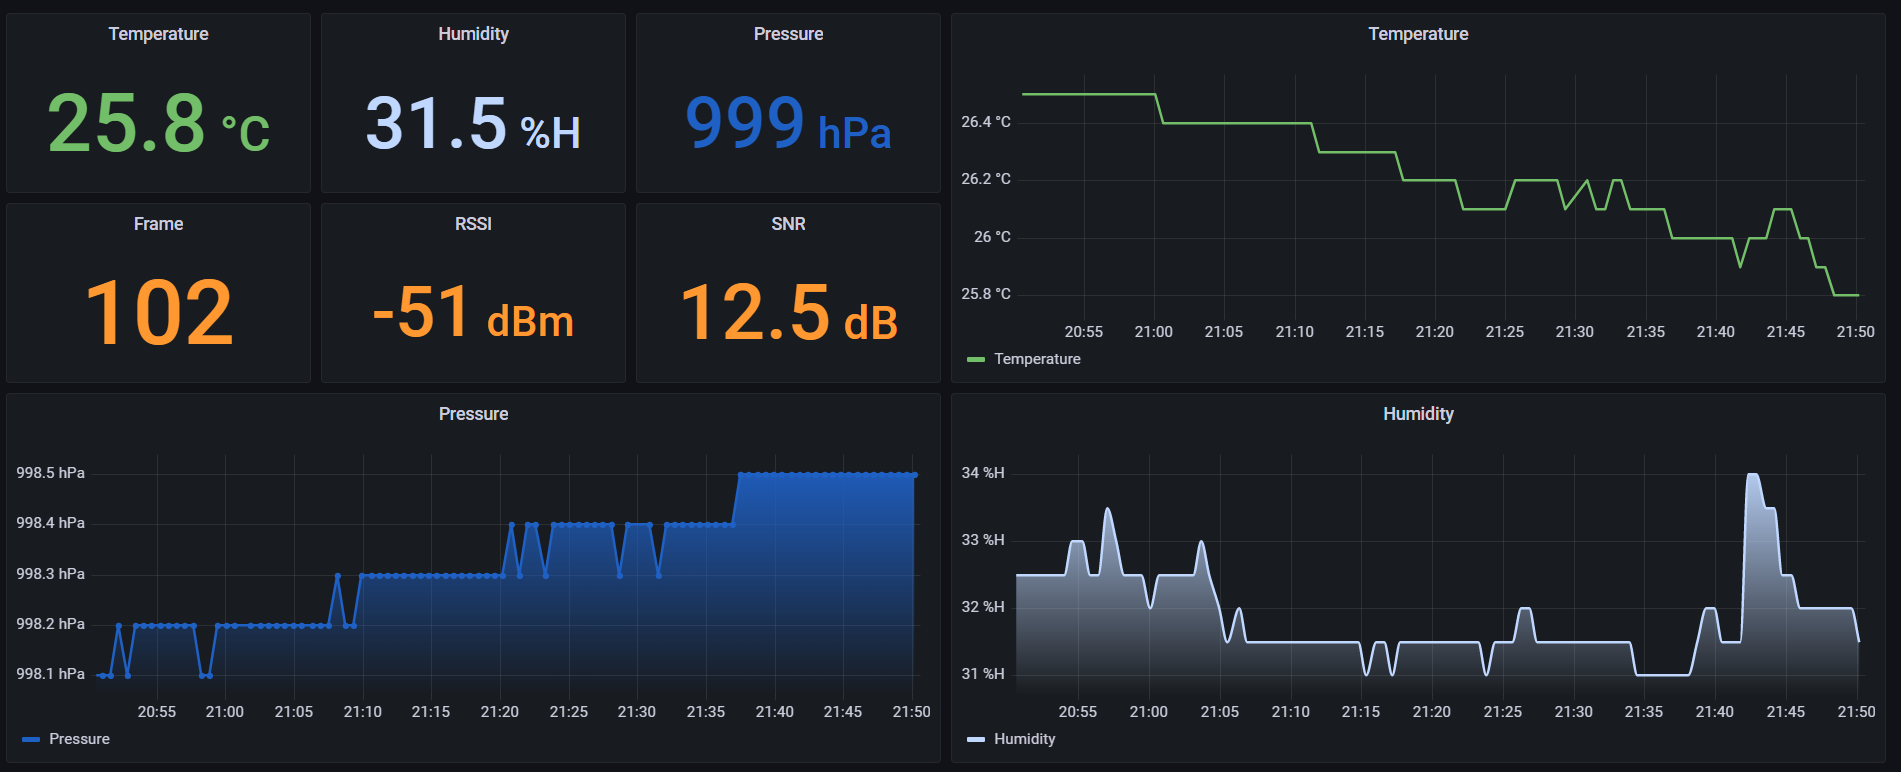
Grafana dashboard setup
- Click on Dashboards -> Browse -> New -> New Dashboard.
- Choose Add a new panel.
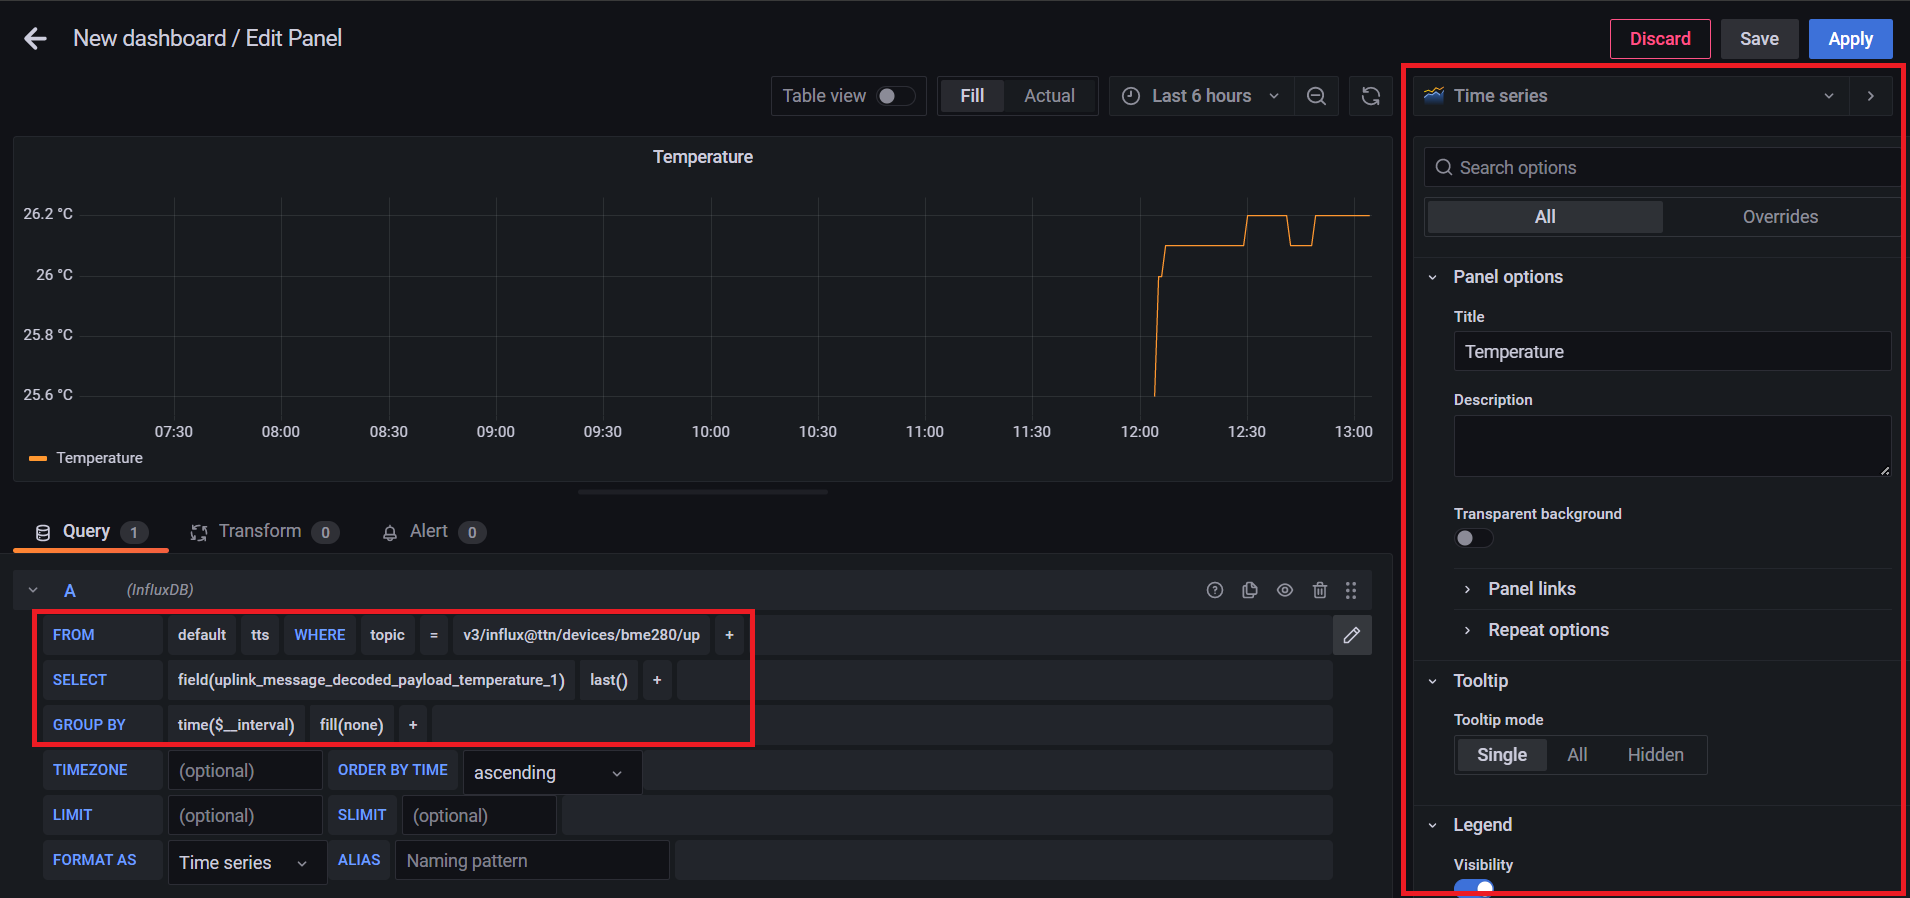
- In the FROM line click on select measurement and select tts.
- Click on + and select topic.
- Click on select tag value and select your TTS device.
- In the SELECT line click on value and select for example uplink_message_decoded_payload_temperature_1.
- Then change mean() to last().
- In the GROUP BY line change fill(null) to fill(none).
- You can change the Type, Title, Unit, Display name, Color scheme and many more in the menu on the right.
- Next, click on Save.
- Continue like this for the other panels.
Grafana panel plugins
If you are interested in how to create your own Grafana panel plugin or import an existing one, follow this tutorial: Grafana panel plugin (for sending downlinks)