
Last updated: August 1, 2025
This article provides Comparative measurements of EU433 and EU868 frequency plans in LoRaWAN networks. By measurements it explores the potential of using the unlicensed 433 MHz band for LoRaWAN technology applications and conducts a comparison with the characteristics of the dominantly used 868 MHz band.
Article is based on a bachelor’s thesis on the topic of Verification of the Communication Capabilities of the LoRaWAN Technology Operating at the 433 MHz Band.
End nodes
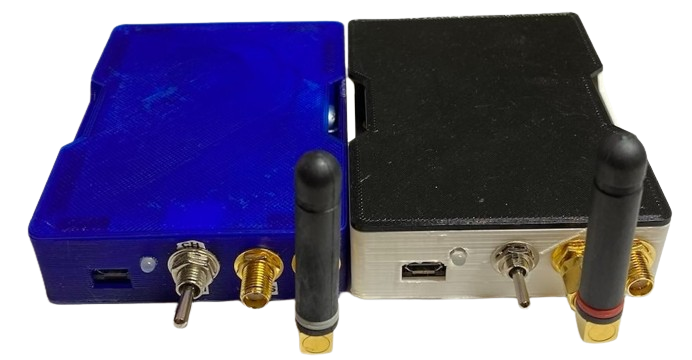
As endpoints, were used GPS trackers from previous articles: 433 MHz GPS Tracker, 868 MHz GPS Tracker and they were configured to work with TTN Mapper for data collection. GPS Tracker as a TTN Mapper.
Gateways
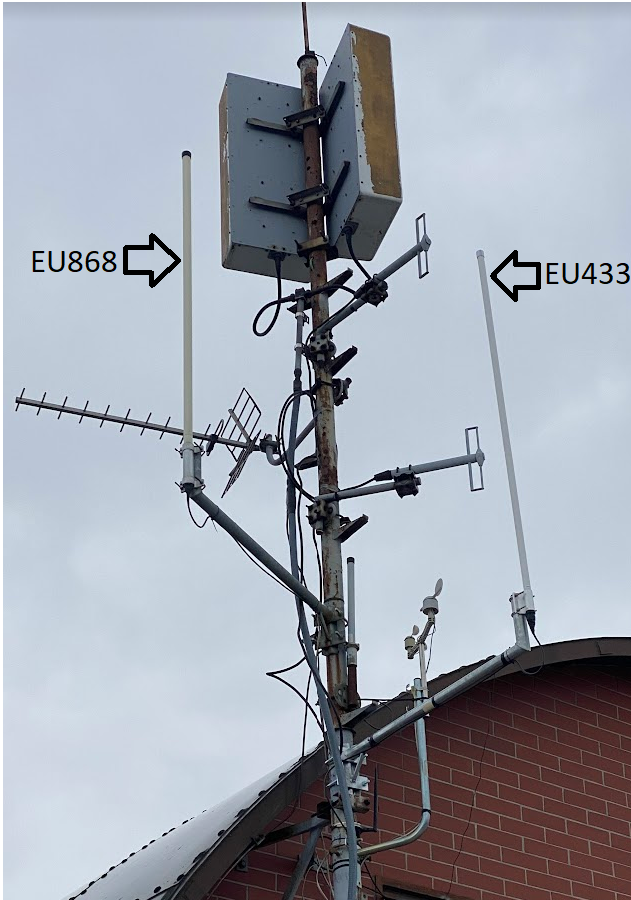
LoRa@VSB Gateways with antennas, placed 25 meters above ground, were used. The parameters of the gateways are described in the articles 433 MHz RAK5146L SPI – LoRa Basics Station, 868 MHz iC880a – LoRa Basics Station.
- GPS: 49.8314122N, 18.1588411E, 280 m
- Address: Ostrava, 17. listopadu 15 (building N)
Network parameters
- Two transmission chains with frequency plans EU433 and EU868 were measured.
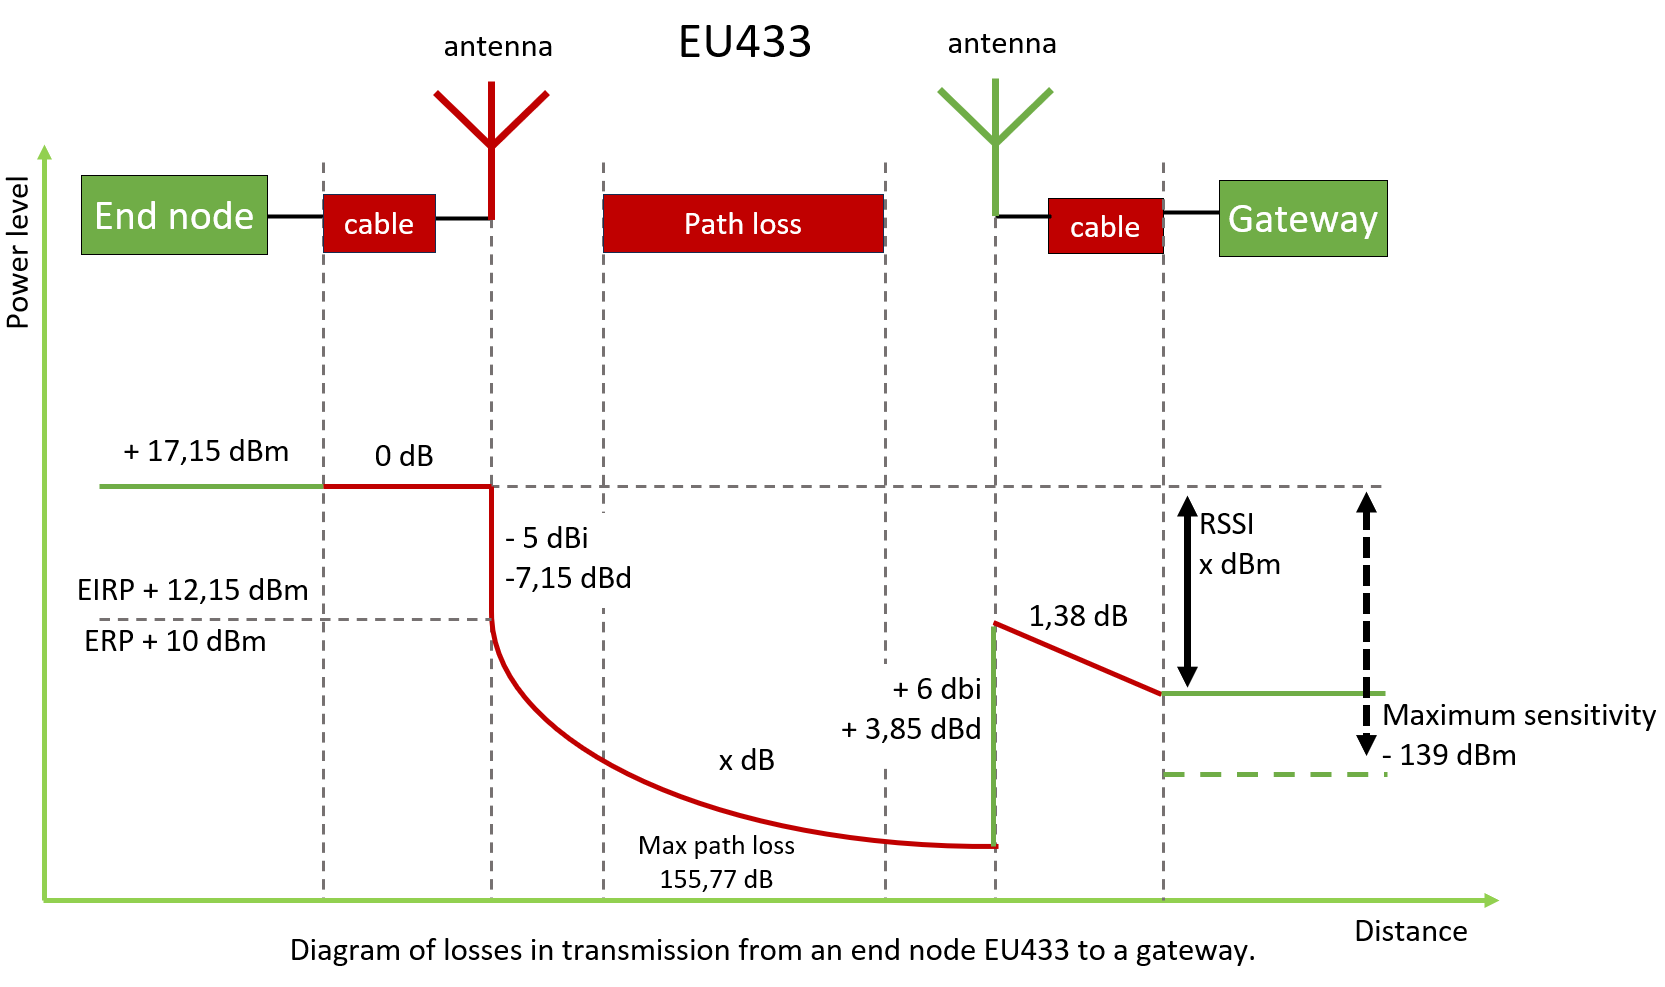
- EU433 uses the frequency band 433,05 to 434,79 MHz and has an Effective Radiated Power (ERP) of 10 dBm.
- The EU868 uses the frequency band 863 to 870 MHz and has an Effective Radiated Power of 14 dBm.
- More information on the individual regional band parameters can be found here: LoRaWAN regional parameters.
- Measurements are taken from the transmission of the endpoint to the gateway, as this is the primary direction of communication in LoRaWAN networks.
| End node EU433 | Gateway EU433 | End node EU868 | Gateway EU868 | |
| Maximum power level of the communication module | +17,15 dBm | +7,55 dBm | +15,55 dBm | +7,85 dBm |
| Cable loss | 0 dB | 1,4 dB | 0 dB | 1,7 dB |
| Antenna gain dBi | -5 dBi | +6 dBi | +0,6 dBi | +10 dBi |
| ERP (Effective Radiated Power) | +10 dBm | + 10dBm | +14 dBm | +14 dBm |
| Antenna gain dBd | -7,15 dBd | + 3,85 dBd | -1,55 dBd | + 7,85 dBd |
| EIRP (Effective Isotropic Radiated Power) | +12,15 dBm | +12,15 dBm | + 16,15 dBm | + 16,15 dBm |
| Maximum sensitivity of the communication module | -148 dBm | -139 dBm | -148 dBm | -137 dBm |
| Maximum path loss | 155,15 dB | 155,75 dB | 164,75 dB | 161,45 dB |
| Sensitivity of the communication module; 125 kHz; SF12 | -136 dBm | -139 dBm | -136 dBm | -137 dBm |
| Maximum path loss; 125 kHz; SF12 | 143,15 dB | 155,75 dB | 152,75 dB | 161,45 dB |
| Sensitivity of the communication module; 125 kHz; SF7 | -123 dBm | -125 dBm | -123 dBm | -126 dBm |
| Maximum path loss; 125 kHz; SF7 | 130,15 dB | 141,75 dB | 139,75 dB | 150,45 dB |
RSSI and SNR
RSSI and SNR will be used as the main metrics for measuring and evaluating the quality of the received signal.
- RSSI (Received Signal Strength Indicator): Measured in dBm, indicates if a signal can be detected. Does not assess signal quality.
- SNR (Signal-to-Noise Ratio): Difference between signal level and noise, measured in dB. Higher SNR indicates a cleaner, higher-quality signal.
LoRa Modulation Thresholds:
- For SF12:
- Minimum SNR: -20 dB
- Minimum RSSI: -135 dBm
- For SF7:
- Minimum SNR: -7,5 dB
- Minimum RSSI: -125 dBm
Scenarios of measurement
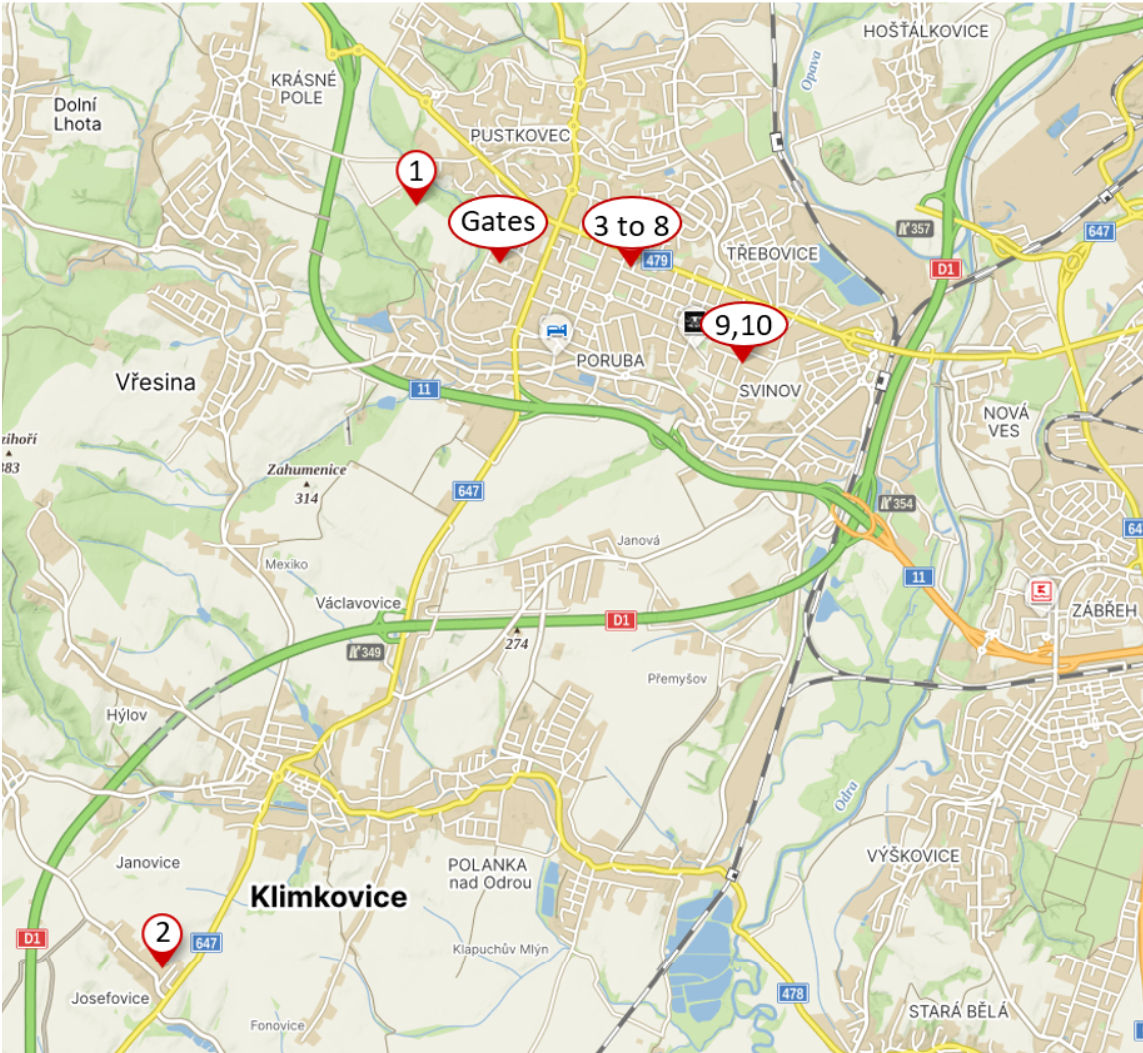
The measurement locations simulate a standard environment where the sensor endpoint could be placed in practice, and also to check possible limits of the link. For this purpose, ten scenarios were practiced, which included four different measurement areas.
| Scenario Description | Distance from Gates | GPS Coordinates |
|---|---|---|
| Gateways | – | N49.83141 E18.15884 |
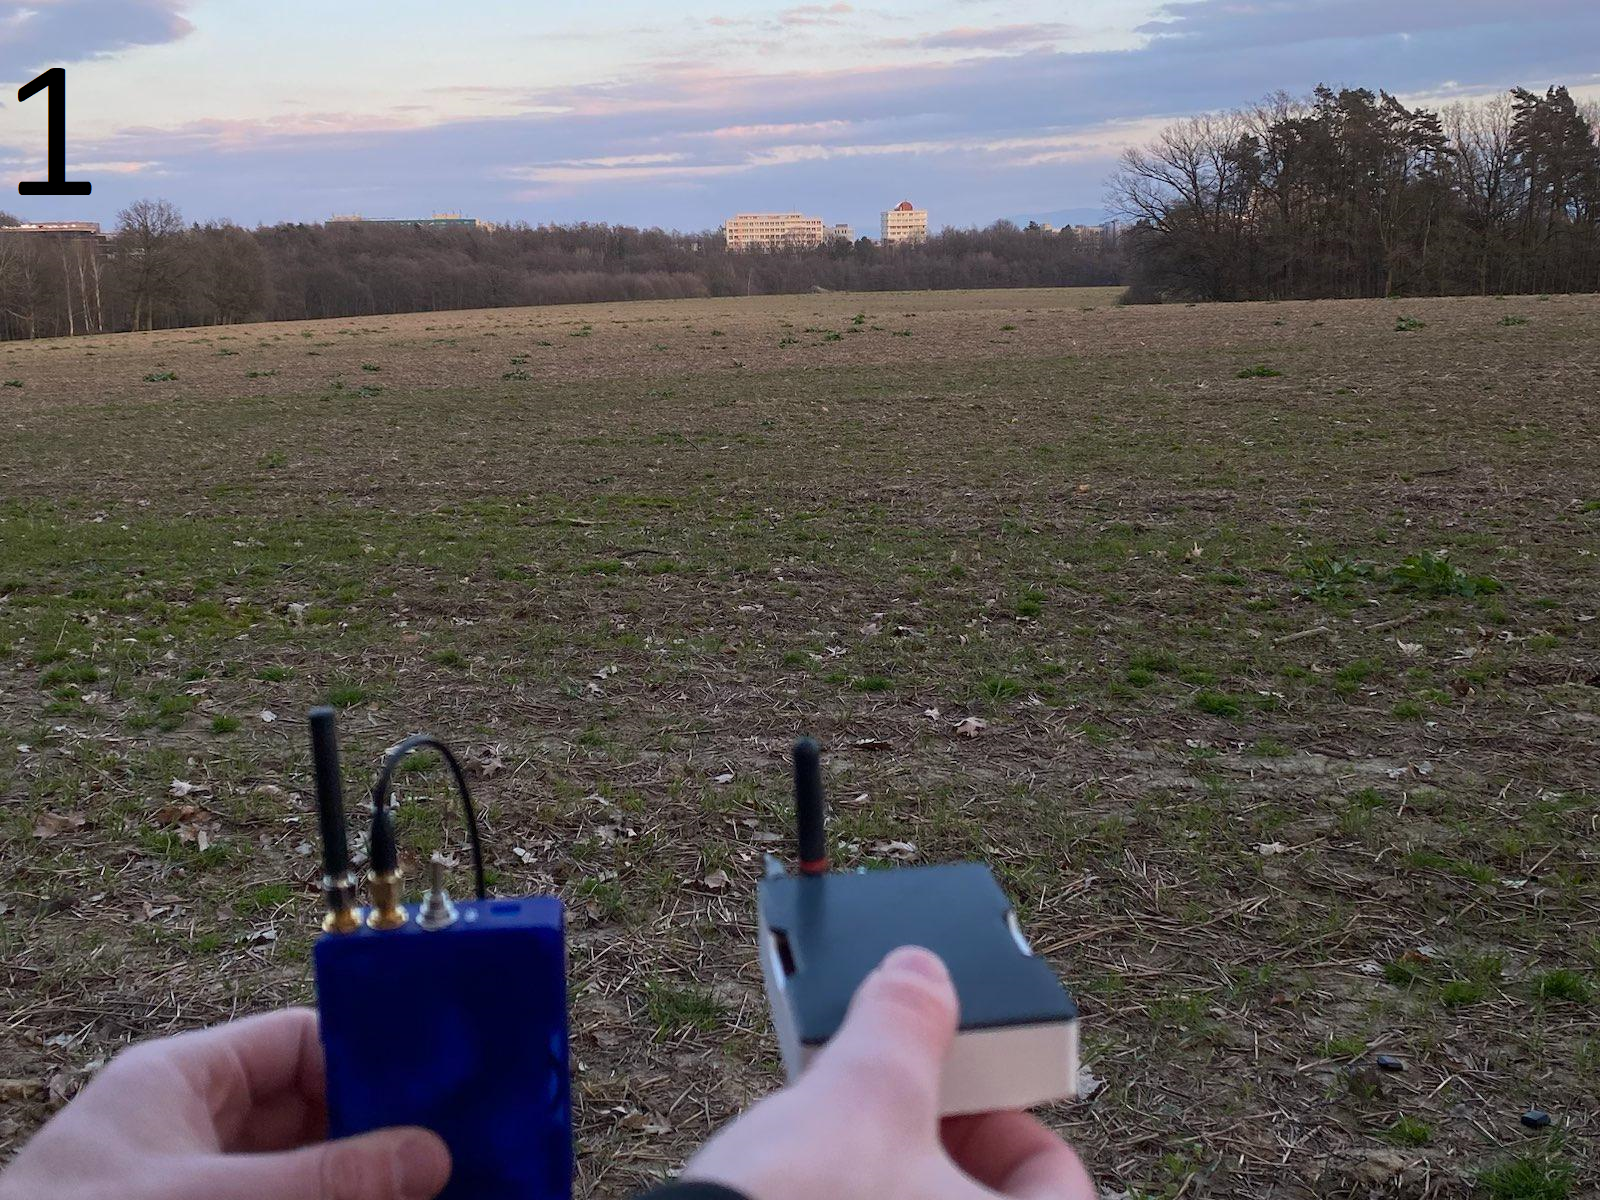
| 1. Direct Line of Sight | 1 km | N49.83582 E18.14652 |
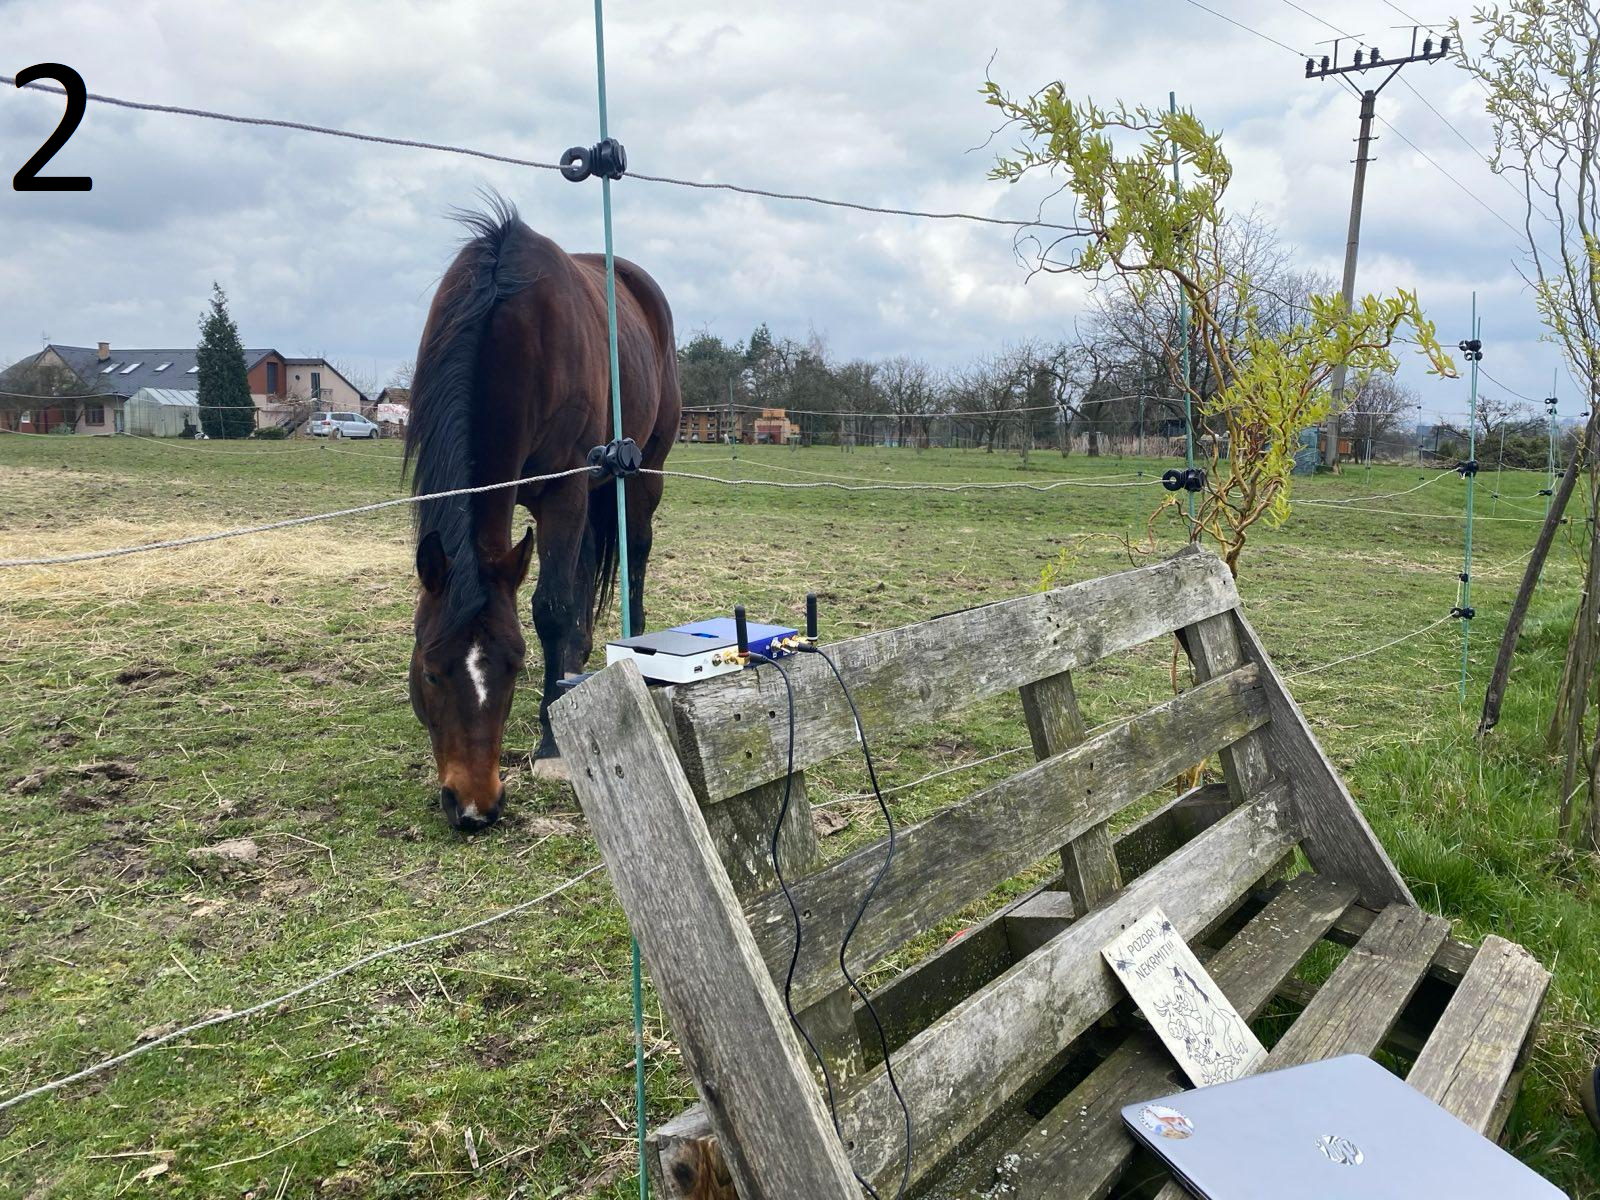
| 2. Countryside | 7,48 km | N49.77061 E18.11423 |
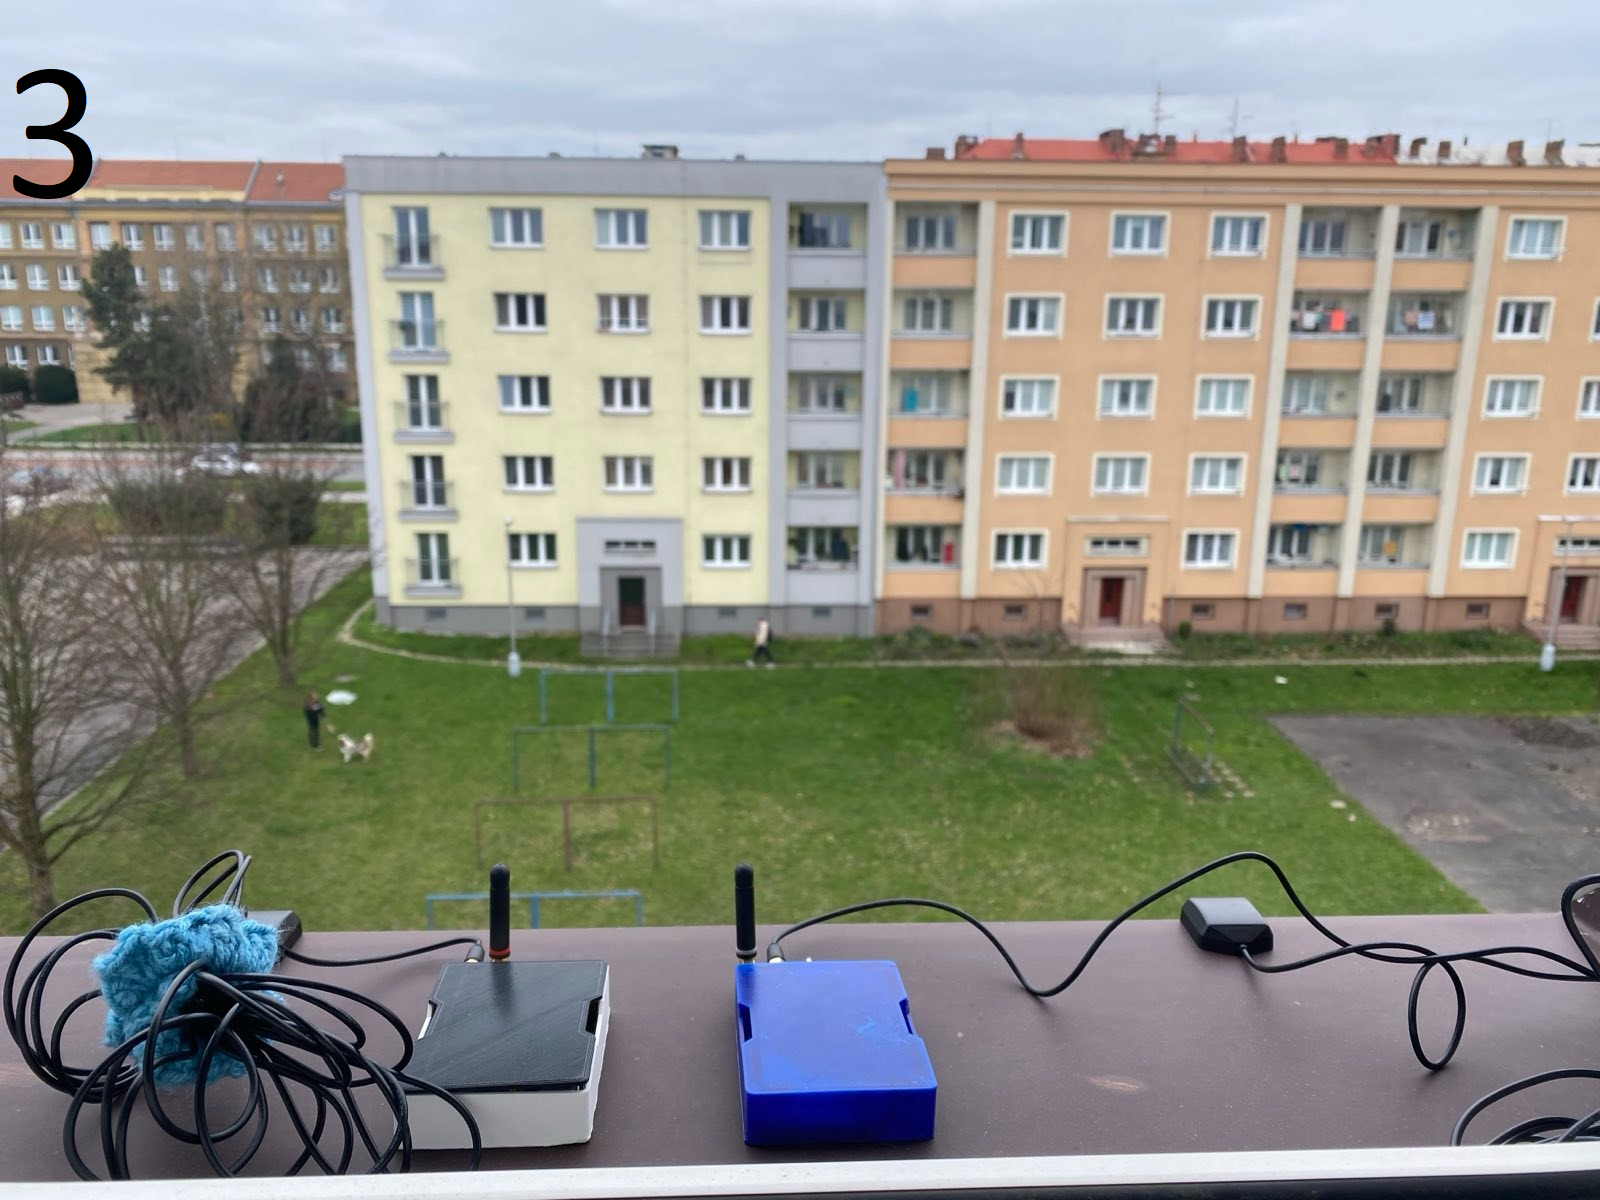
| 3. Near Side 5th Floor | 1,25 km | N49.83114 E18.17623 |
| 4. Far Side 5th Floor | 1,25 km | N49.83114 E18.17623 |
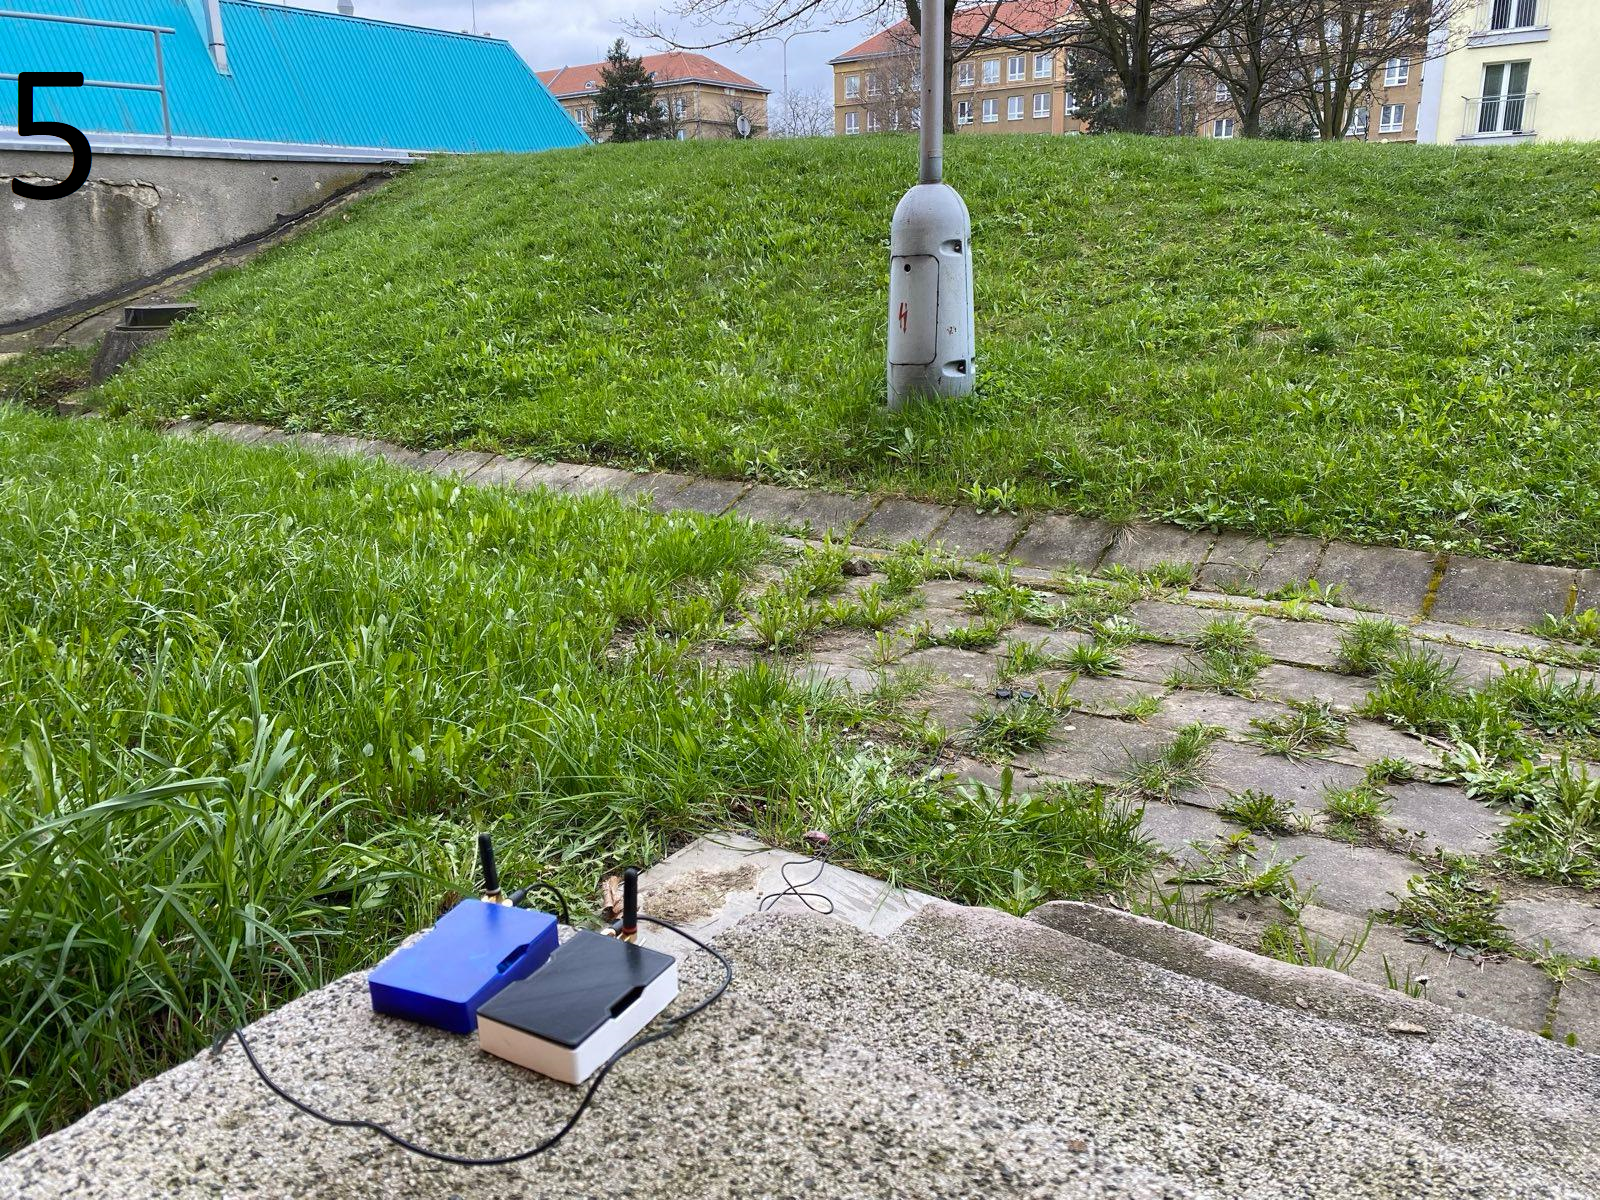
| 5. Near Side Exterior | 1,25 km | N49.83114 E18.17623 |
| 6. Far Side Exterior | 1,25 km | N49.83114 E18.17623 |
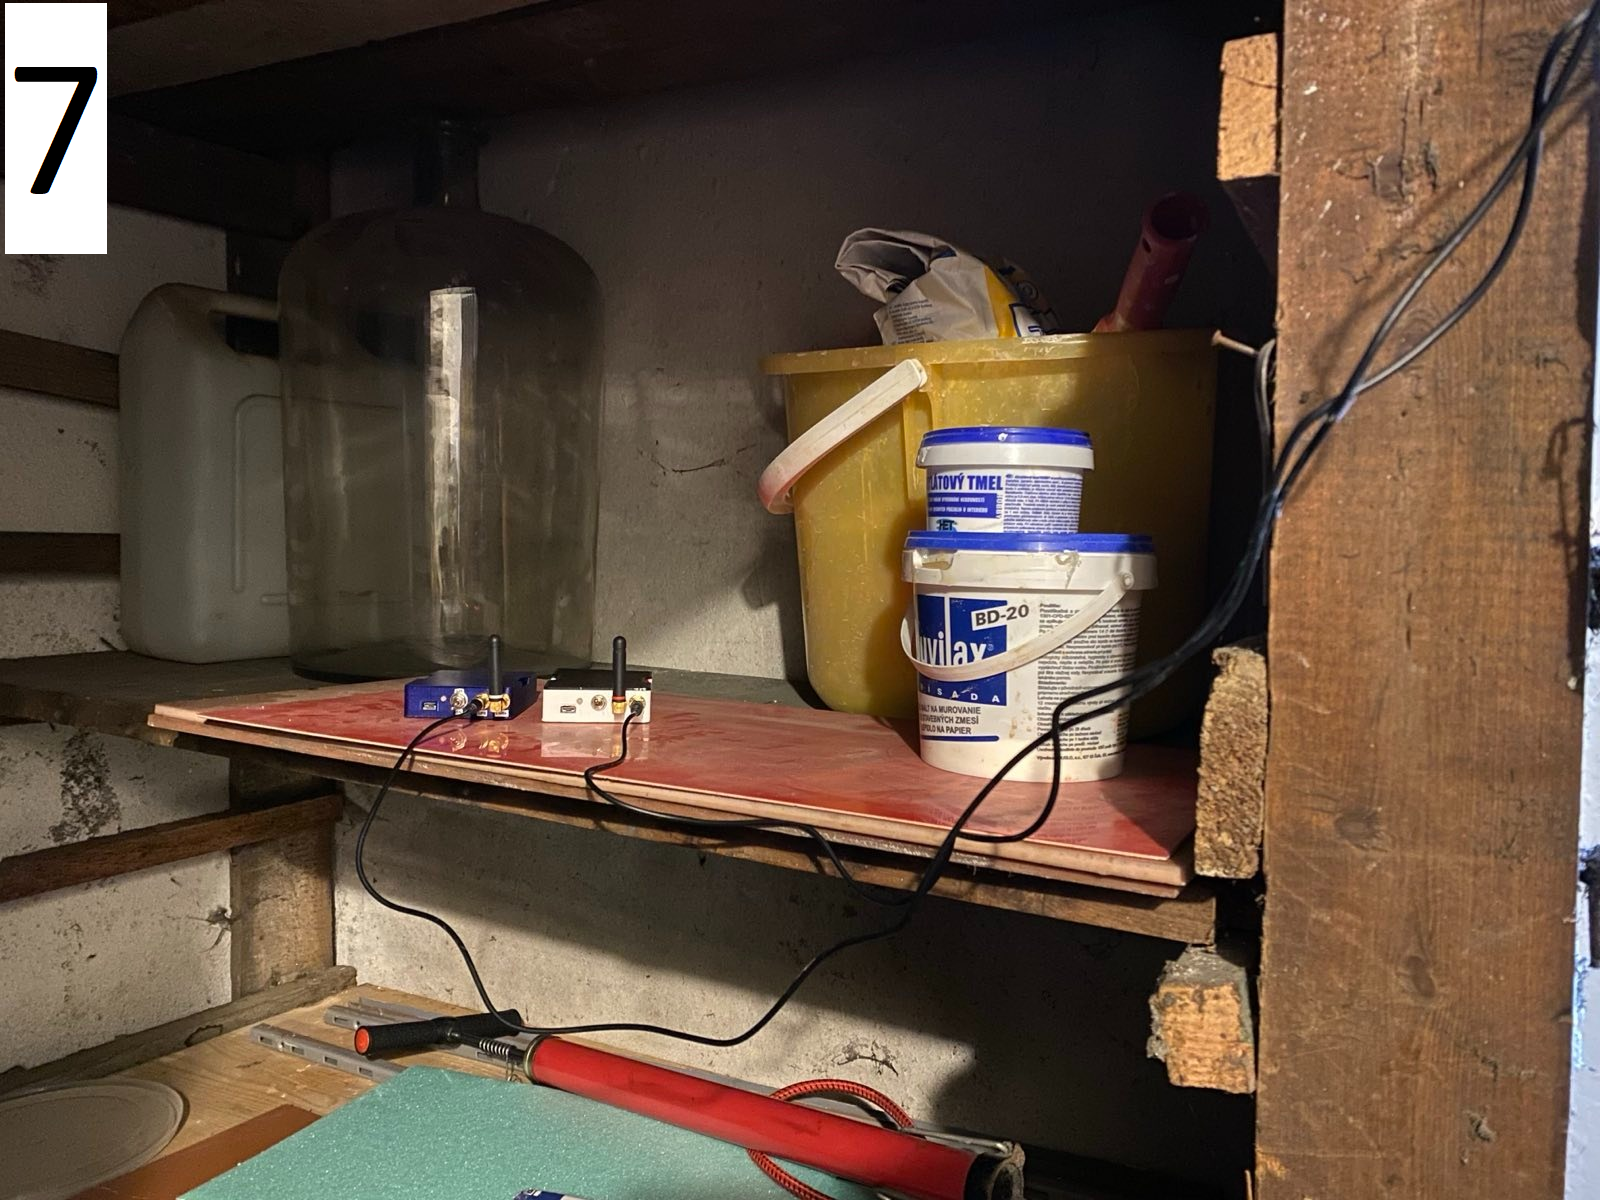
| 7. Basement | 1,25 km | N49.83114 E18.17623 |
| 8. Electrical Cabinet Simulation | 1,25 km | N49.83114 E18.17623 |
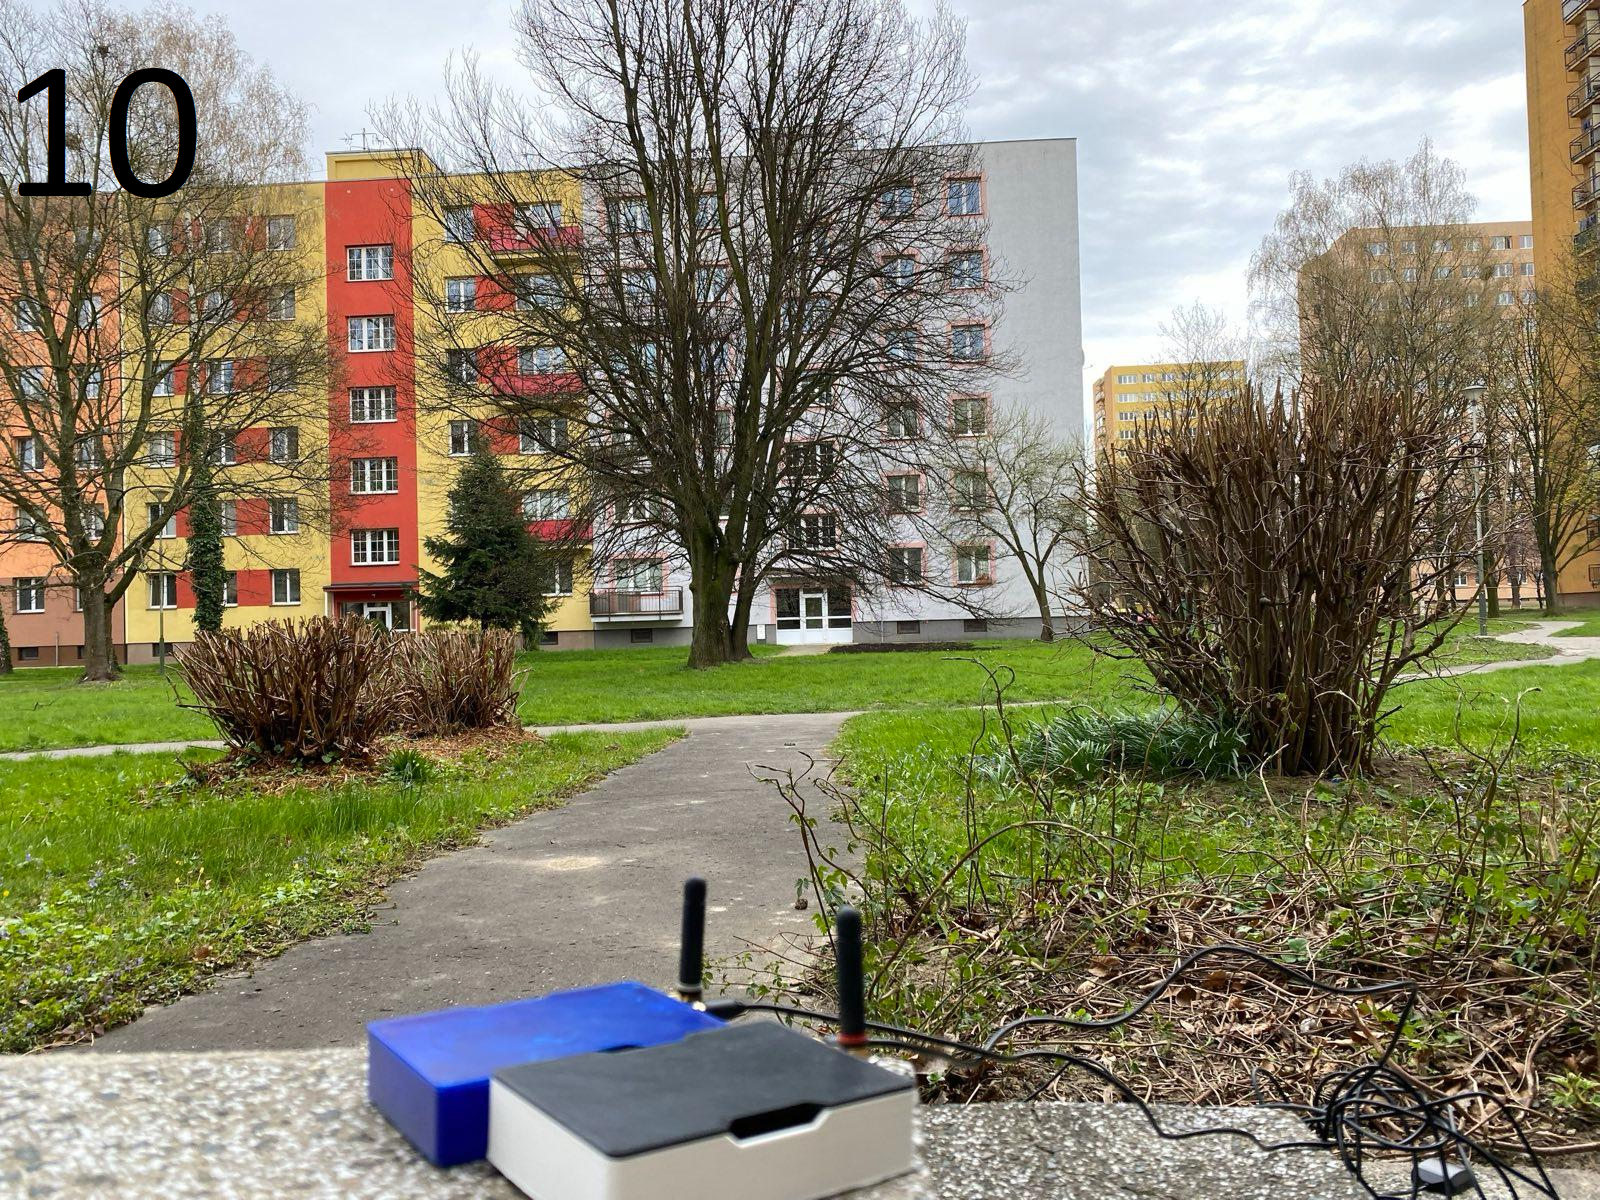
| 9. Near Side Exterior | 2,5 km | N49.82278 E18.19102 |
| 10. Far Side Exterior | 2,5 km | N49.82278 E18.19102 |
Results of measurement
- The measurements took place over three weeks across four locations. As distance increased, the spreading factor was raised from SF7 to SF12.
- Minimum of 10 messages were received per scenario, which were averaged to improve accuracy.
- After each measured scenario, the data was downloaded from the TTNmapper experimental platform in CSV format.
- The data was then categorized based on recorded timestamps into individual scenarios.
| Scenario Description |
EU433 RSSI [dBm] |
SNR [dB] |
EU868 RSSI [dBm] |
SNR [dB] |
| 1. Direct Line of Sight 1 km | -86,40 | 11,23 | -83,11 | 8,60 |
| 2. Countryside 7,48 km | -120,57 | -15,46 | -112,27 | -5,20 |
| 3. Near Side 5th Floor 1,25 km | -98,67 | 6,29 | -96,71 | 6,70 |
| 4. Far Side 5th Floor 1,25 km | -103,88 | -0,03 | -105,13 | 1,97 |
| 5. Near Side Exterior 1,25 km | -111,62 | -3,58 | -109,33 | 2,85 |
| 6. Far Side Exterior 1,25 km | -112,25 | -4,84 | -111,93 | -3,86 |
| 7. Basement 1,25 km | -110,33 | -3,83 | -112,65 | -2,71 |
| 8. Electrical Cabinet Simulation 1,25 km | -116,33 | -9,00 | – | – |
| 9. Near Side Exterior 2,5 km | -116,00 | -9,14 | -111,50 | -2,06 |
| 10. Far Side Exterior 5 km | -118,11 | -10,89 | -109,67 | -6,72 |
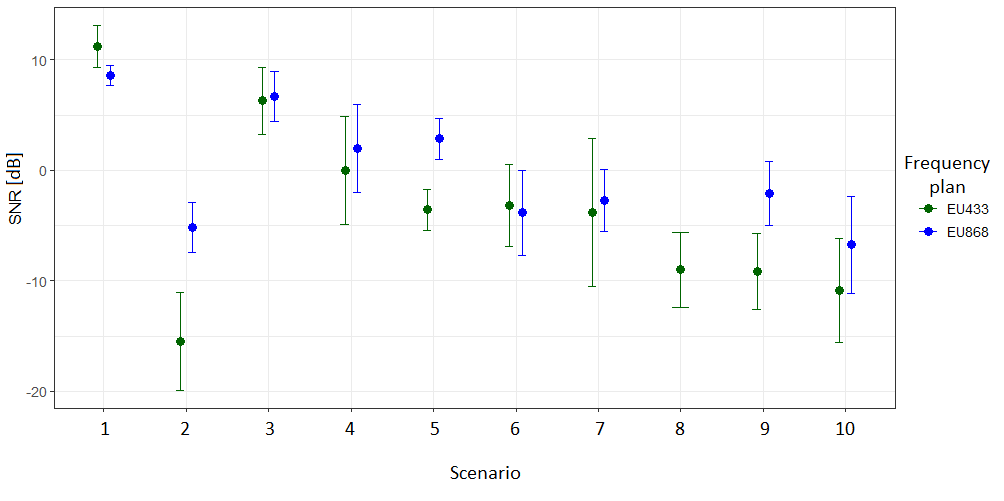
Comparison of Signal-to-Noise Ratio (SNR) Across Different Scenarios for EU433 and EU868 Frequency Plans
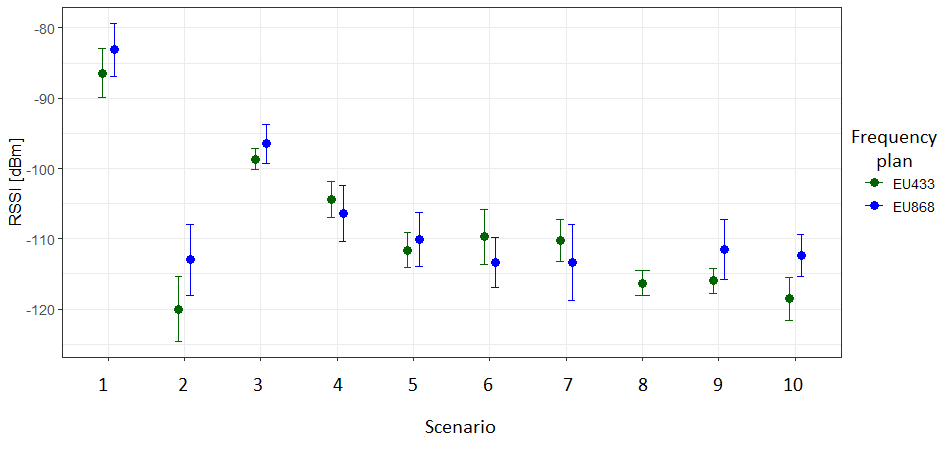
Comparison of RSSI Across Different Scenarios for EU433 and EU868 Frequency Plans
- The results show that lower frequencies around 433 MHz have better propagation capabilities, which would be even more apparent if the ERP for EU433 were not regulated to be 4 dBm lower and also antenna gain 4 dBi lower than for EU868.
- It was found that in nearly all scenarios, EU433 exhibits lower SNR. Even in situations where RSSI was comparable with EU868, there was a tendency for lower average SNR values for EU433. This may be a result of greater use of the frequency spectrum or higher reflectivity of the 433 MHz frequency, which can lead to more multipath reception of the signal, potentially perceived as noise.
- In conclusion, with the current network settings, EU433 performs worse, but it offers advantages in cases of shorter distances and heavily shaded environments. For longer distances, whether in less or more shaded areas, EU868 yields better results.