
| Project type: | Satellite LoRa receive station with automatic antenna tracking |
| Network: | TinyGS |
| Observed bands: | UHF satellite LoRa signals around 400-402 MHz and 430-438.5 MHz |
| Control platform: | Raspberry Pi 5, Python, systemd, SynScan mount control |
| Source code: | SynScan-Satellite-Tracker-TinyGS |
| TinyGS project: | Official TinyGS GitHub repository |
| Last updated: | April 27, 2026 |
This article describes an experimental receiving system for satellite LoRa transmissions in the TinyGS community network. The system was developed as part of a diploma thesis focused on satellite communication via LoRa technology. The goal was to compare a directional automatically tracked antenna with passive receiving antennas under real operating conditions.
Project overview
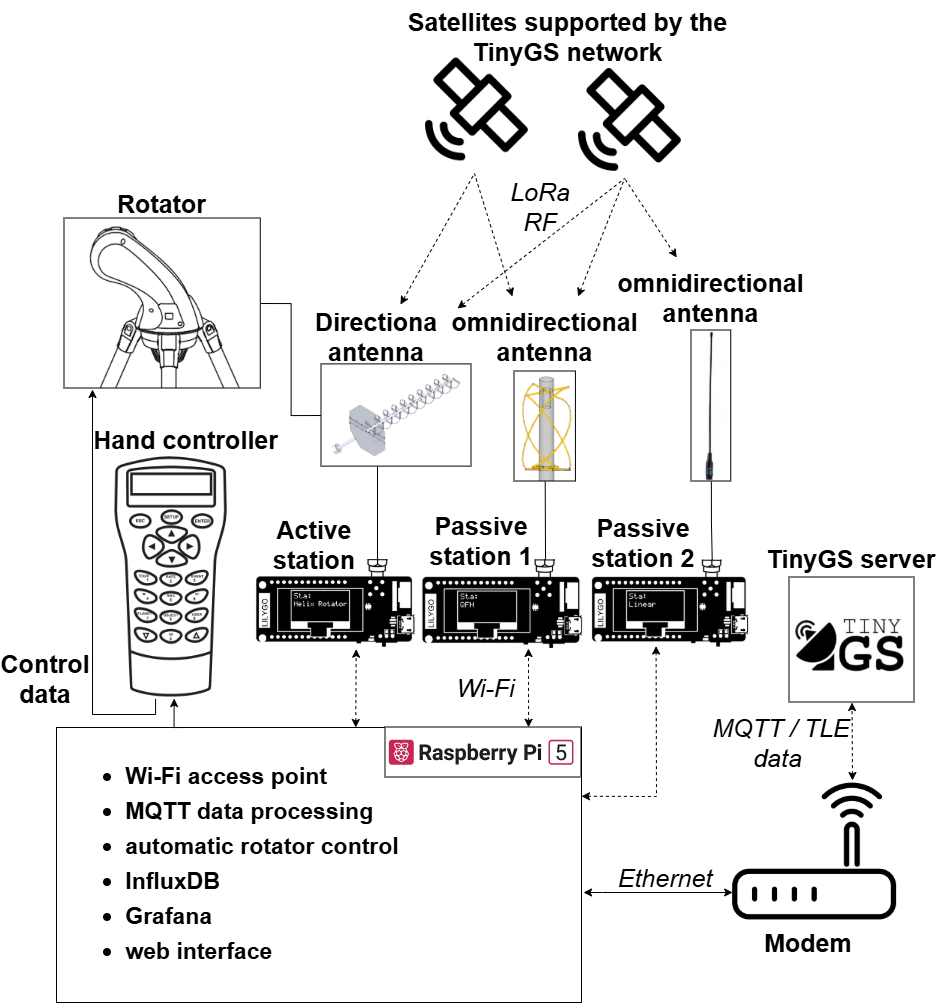
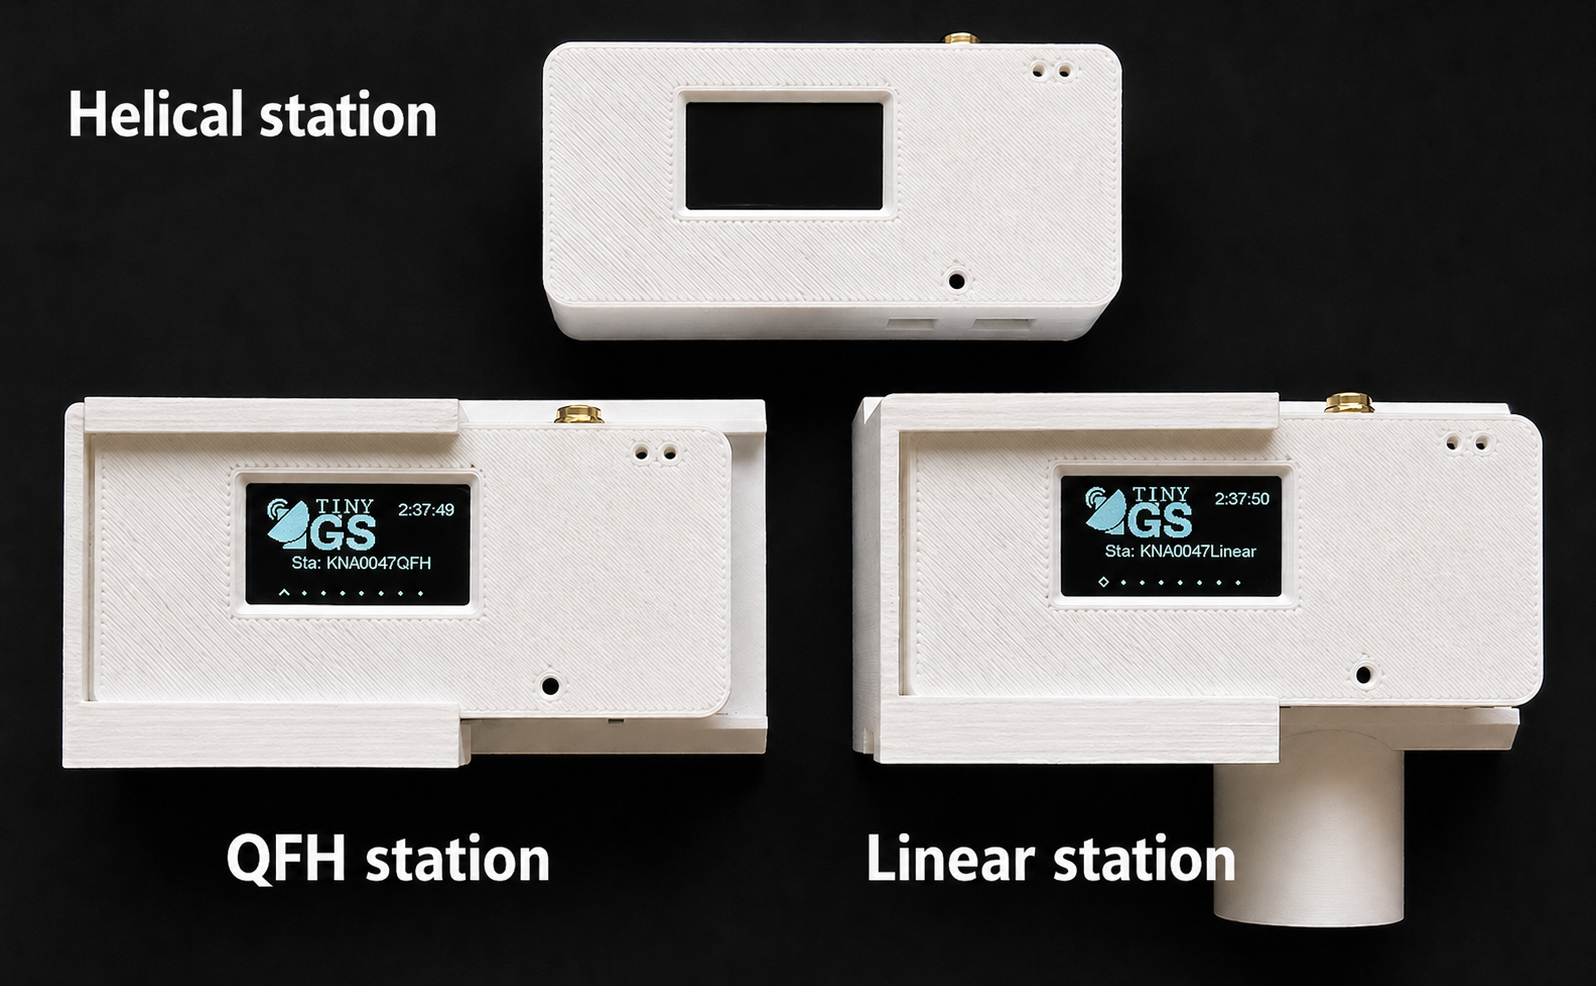
The experiment used three receiving stations installed at the same location and operated at the same time. The stations used comparable TinyGS-compatible LoRa receiving hardware, but each station had a different antenna configuration:
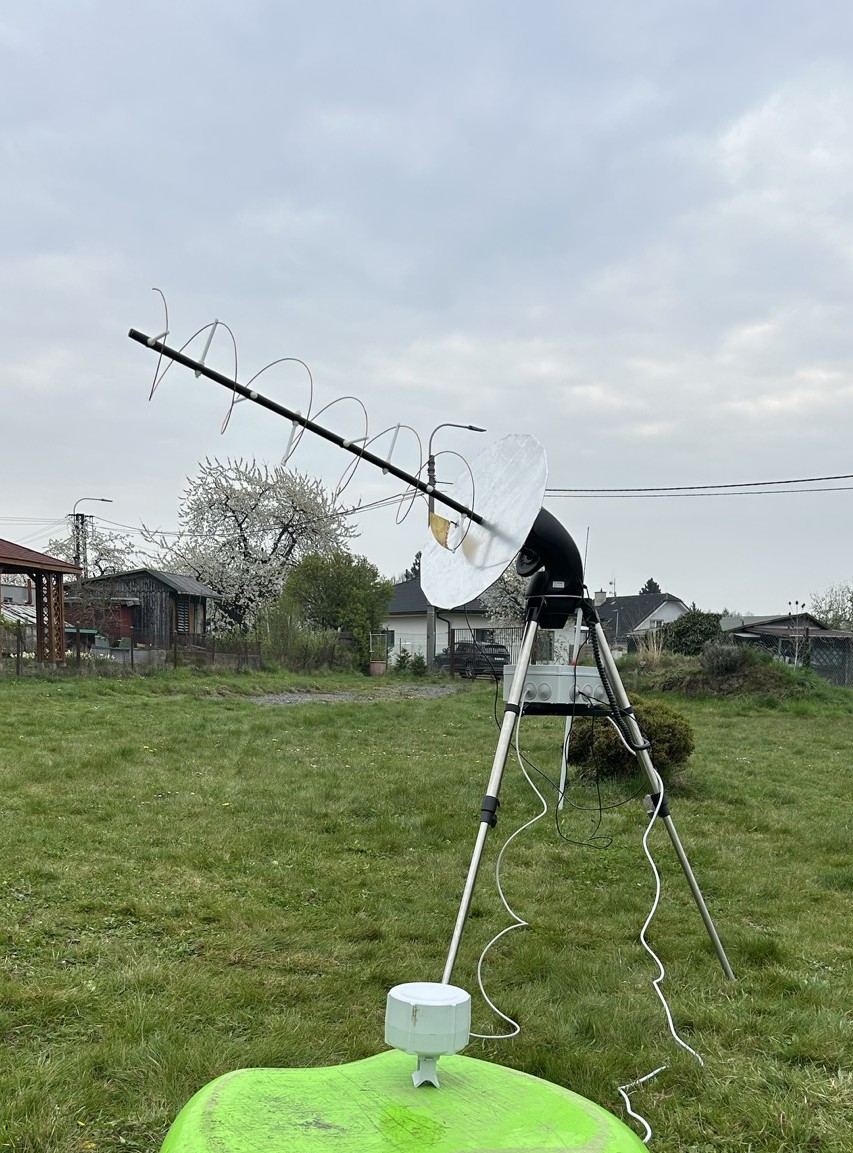
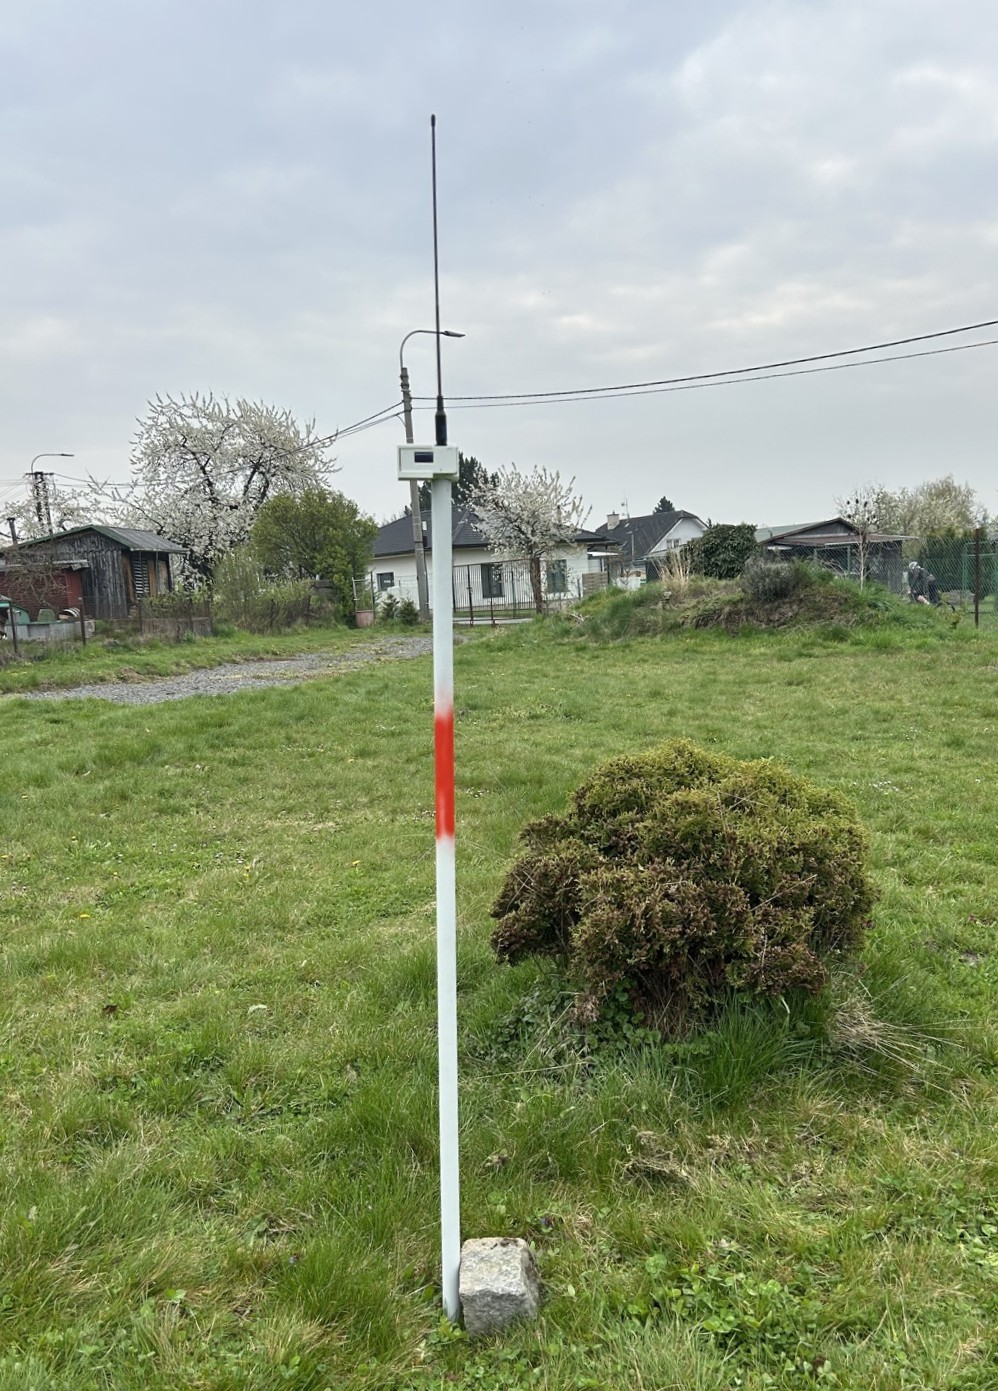
- Tracked helical antenna: a directional right-hand circularly polarized antenna mounted on a SynScan-compatible rotator.
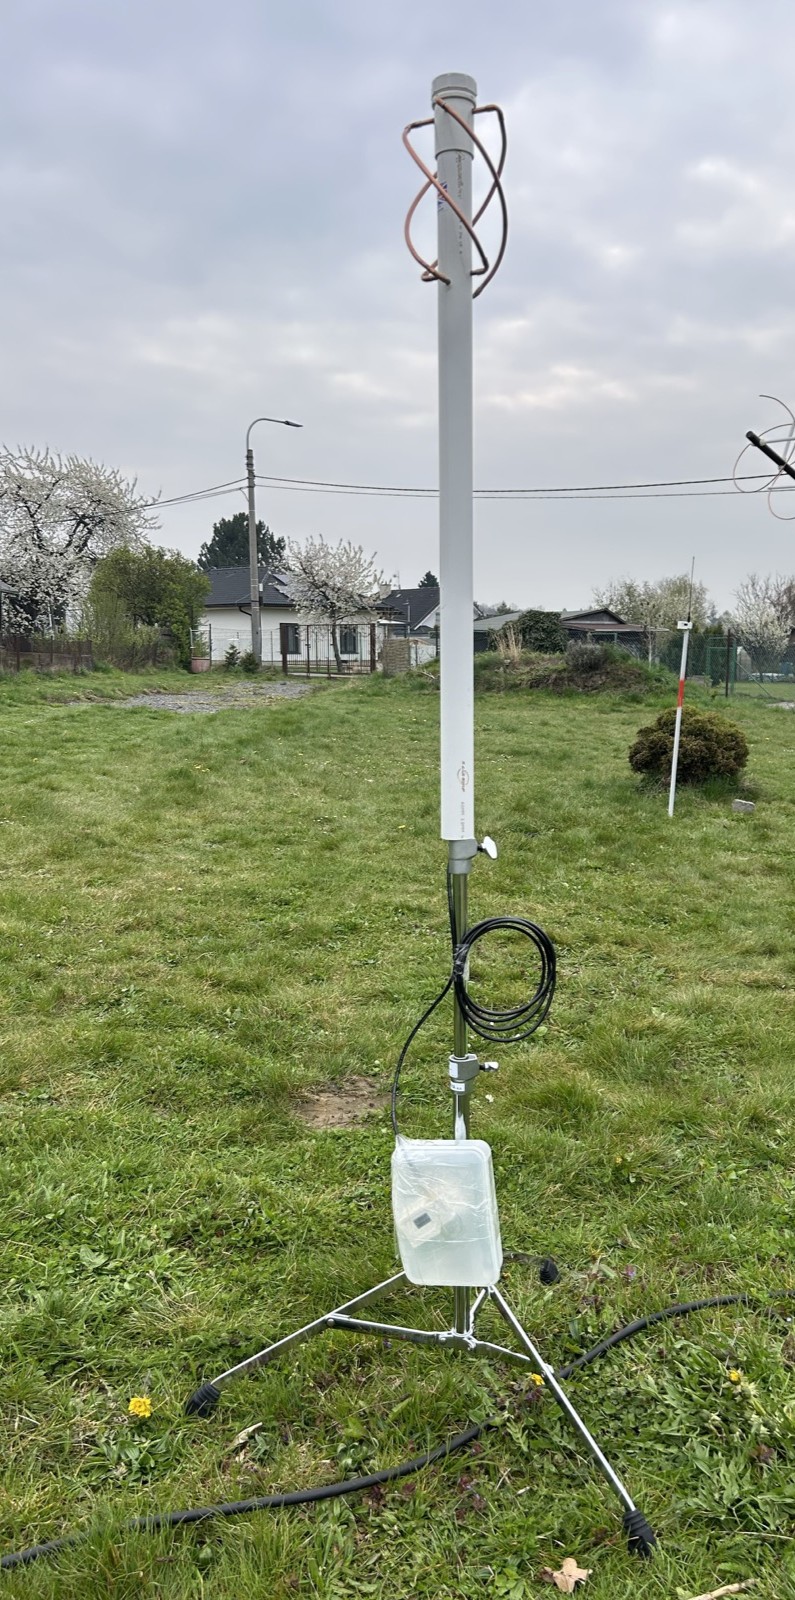
- Passive QFH antenna: a wide-coverage circularly polarized reference antenna without mechanical tracking.
- Passive linear whip antenna: a simple linearly polarized reference antenna added to observe the influence of polarization and elevation coverage.
The local control software receives TinyGS MQTT state updates, resolves the currently relevant satellite by its NORAD identifier, computes its azimuth and elevation from local TLE data, and sends movement commands to a SynScan mount. Received frames and reception metadata can be stored in InfluxDB and visualized in Grafana.
Hardware setup
- Raspberry Pi 5 used as the local control and data processing computer
- SynScan-compatible Sky-Watcher AZ-GTi mount used for antenna pointing
- TinyGS-compatible ESP32 LoRa receiving units
- Directional helical antenna designed for approximately 435 MHz
- Passive QFH antenna for approximately 435 MHz
- Passive linear whip antenna used as an additional reference
- InfluxDB and Grafana for telemetry storage and visualization
The active station used a helical antenna on a rotator. The passive stations were placed nearby so that all configurations experienced comparable satellite passes, weather, local interference and surrounding reflections.
 |
 |
 |
| Tracked helical antenna | Passive QFH antenna | Passive linear antenna |
Software architecture
The software layer connects four main parts of the system:
- TinyGS MQTT input – receives station state messages and frame metadata.
- TLE-based satellite geometry – uses local TLE data to calculate azimuth, elevation and slant range.
- SynScan mount control – converts the calculated target position into SynScan-compatible movement commands.
- InfluxDB/Grafana output – stores received frames, state data and derived pass information for later analysis.
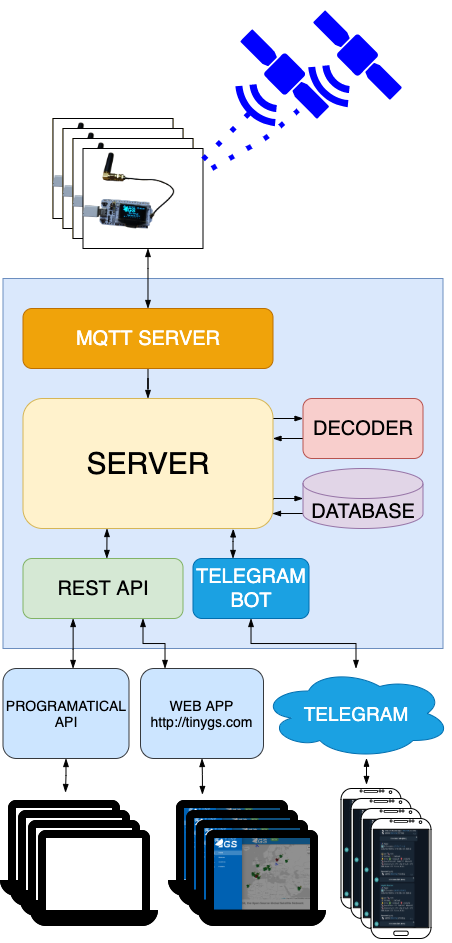
The upstream TinyGS firmware, supported-board information, network architecture and configuration documentation are maintained in the official TinyGS GitHub repository. Useful TinyGS references for this project are the TinyGS Wiki, the Quick Start guide, the Ground Station configuration page and the TinyGS releases.
The public implementation is available on GitHub:
https://github.com/MiraKnapovsky/SynScan-Satellite-Tracker-TinyGS
The repository contains the Python tracker, MQTT listener, Flask web interface, systemd service templates, Grafana dashboards and example configuration files.
Grafana dashboards
Grafana was used as the main visualization layer for checking the state of the receiving stations and for preparing the experimental evaluation. Each station used the same dashboard structure, which made the tracked helical antenna, passive QFH antenna and passive linear antenna directly comparable.
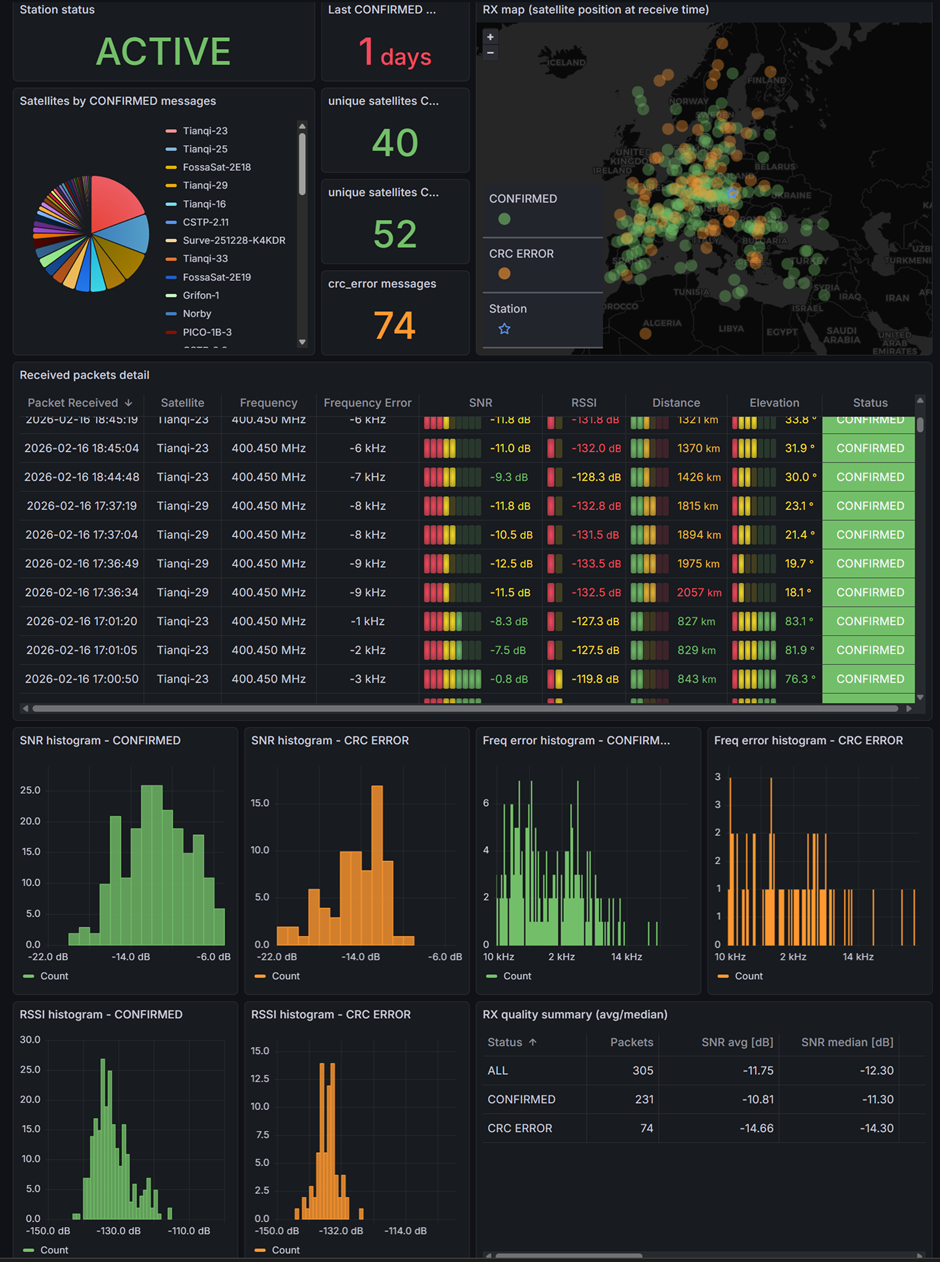
The overview part of the dashboard shows the operational state of a station, the latest received packets and basic reception quality indicators. It includes panels for the last confirmed message, the number of confirmed satellites, received packet details, RSSI, SNR and frequency error.
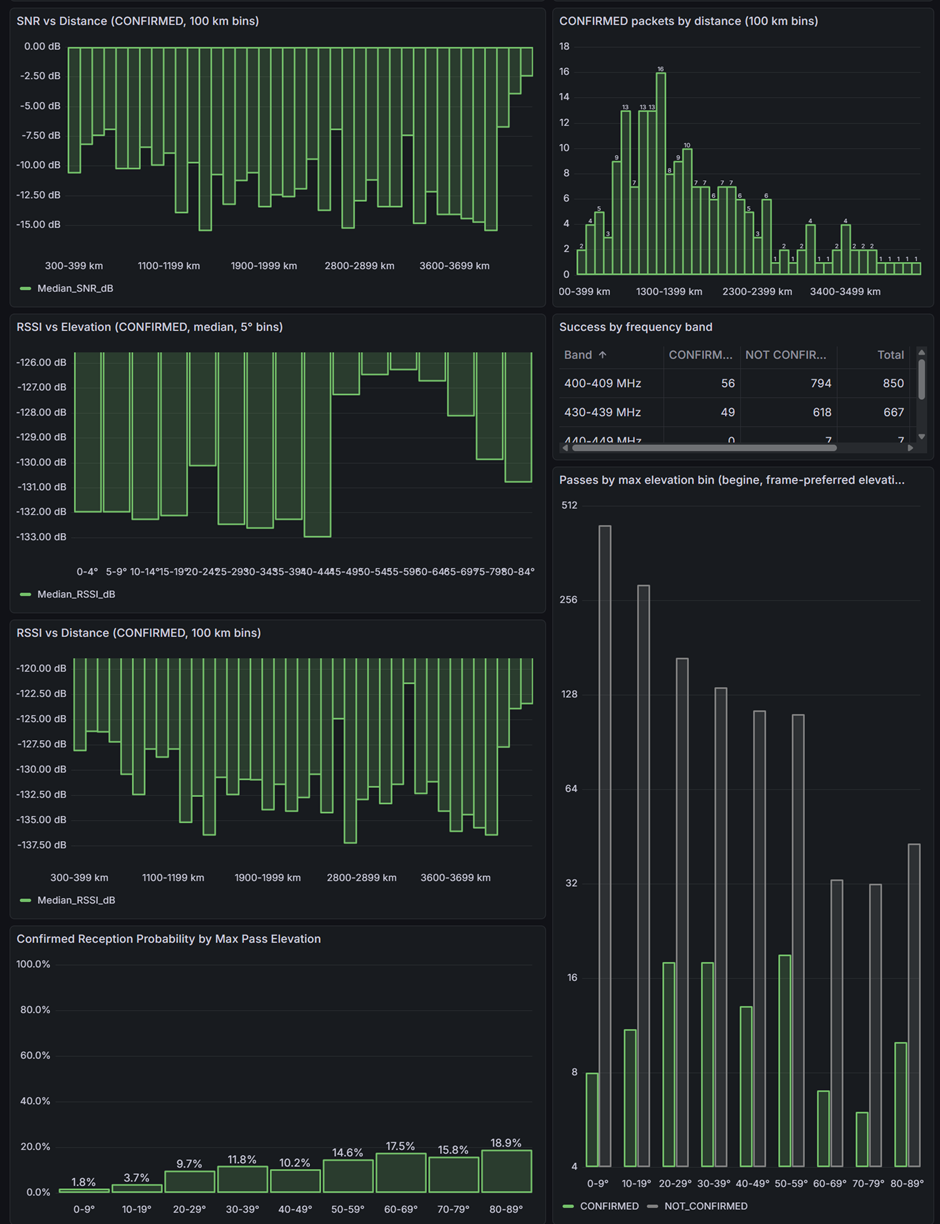
The analytical part of the dashboard is focused on the relationship between reception quality and satellite pass geometry. It is used to inspect RSSI and SNR as a function of distance or elevation, compare reception by frequency band, and identify satellite passes where no confirmed packet was received.
The dashboards are not only a presentation layer. They also helped during the experiment by making it possible to detect missing data, compare the three antenna configurations during operation, and verify whether the stored TinyGS metadata were suitable for later processing.
Main software components
synscan_follow_sat.py– main tracking loop that selects a target, computes azimuth/elevation and sends mount commands.synscan_web.py– local Flask web interface for status, configuration, service control and manual movement.mqtt_tinygs_listen.py– TinyGS MQTT listener used for state updates and received frame processing.mqtt_geo.py– TLE-based satellite lookup and geometry calculation helpers.mqtt_storage.pyandmqtt_filters.py– helpers for storing, filtering and normalizing received data.import_requests.py– downloads supported TinyGS satellite information and prepares local TLE data.
Basic setup flow
The full installation procedure is maintained in the GitHub repository. The typical setup path is:
- Prepare a Raspberry Pi or Debian machine with Python 3.10+ and systemd.
- Connect the SynScan-compatible mount over serial or USB-to-serial.
- Prepare the TinyGS receiving units and configure the TinyGS MQTT credentials.
- Clone the project repository.
- Create a Python virtual environment and install dependencies.
- Download or update local TLE data.
- Configure station position, serial port and tracker limits in
synscan_config.json. - Run the MQTT listener, the tracking loop and the local web interface.
- Optionally enable the provided systemd services and Grafana dashboards.
$ git clone https://github.com/MiraKnapovsky/SynScan-Satellite-Tracker-TinyGS.git "$HOME/synscan_tinygs_tracker"
$ cd "$HOME/synscan_tinygs_tracker"
$ python3 -m venv tinygs_mqtt/env
$ source tinygs_mqtt/env/bin/activate
$ python -m pip install --upgrade pip
$ python -m pip install -r requirements.txt
Before real mount movement is enabled, the tracker should be tested in dummy mode. This allows the software chain to be validated without physically moving the antenna.
Experiment
The measurement was performed as a 48-hour experiment from April 16, 2026 09:00 UTC to April 18, 2026 09:00 UTC. The receiving location used for satellite geometry calculations was:
| Latitude: | 49.831 |
| Longitude: | 18.162 |
| Altitude: | 261 m |
| Minimum elevation: | 0 degrees |
The analysis focuses mainly on confirmed TinyGS frames, satellite pass detection probability, RSSI, SNR and the elevation of the satellite at reception time. The public results below use the primary evaluation dataset selected for a consistent comparison of the three antenna configurations.
Main results
The evaluated dataset contained:
| Satellites in analysis: | 34 |
| Confirmed frames: | 1298 |
| Observable physical passes: | 389 |
| Passes received by at least one station: | 243 (62.47%) |
In this dataset, the linear whip antenna received the highest number of confirmed frames, while the tracked helical antenna achieved the best RSSI and SNR values for frames that it did receive.
| Antenna configuration | Confirmed frames | Share of frames at 0-30 degrees elevation |
| Tracked helical antenna | 404 | 77.4% |
| Linear whip antenna | 563 | 86.3% |
| QFH antenna | 329 | 64.7% |
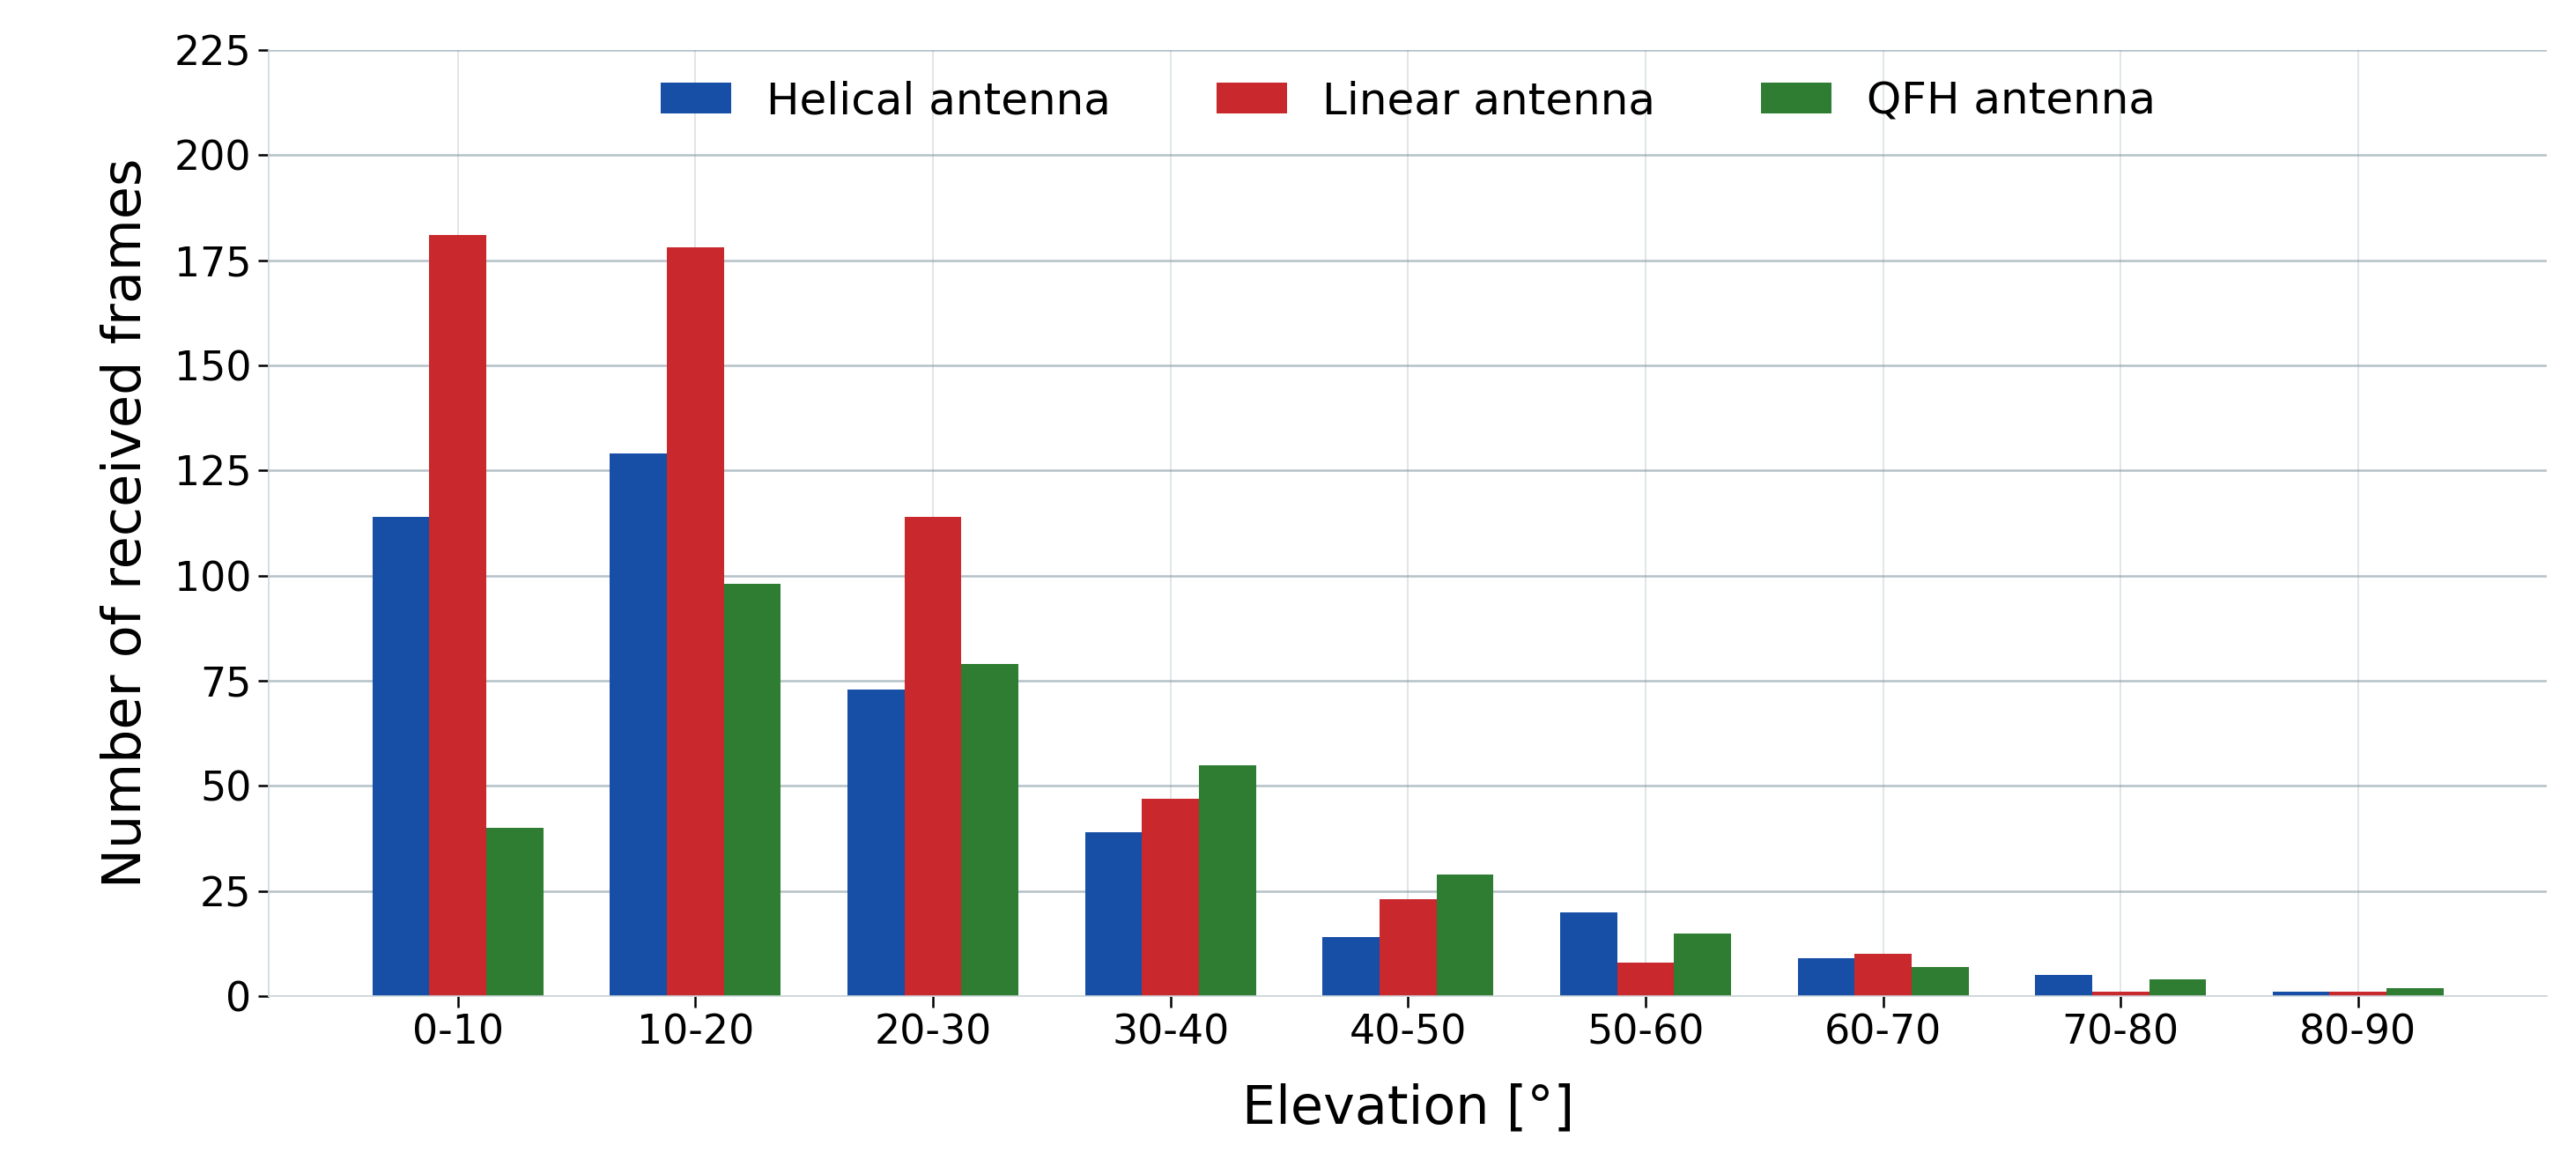
The frame count is not the whole story. The helical antenna was directional and had to physically move to each selected target. Passive antennas could cover a larger part of the sky without mechanical retargeting, which was useful when TinyGS target selection changed quickly or when satellite passes overlapped.
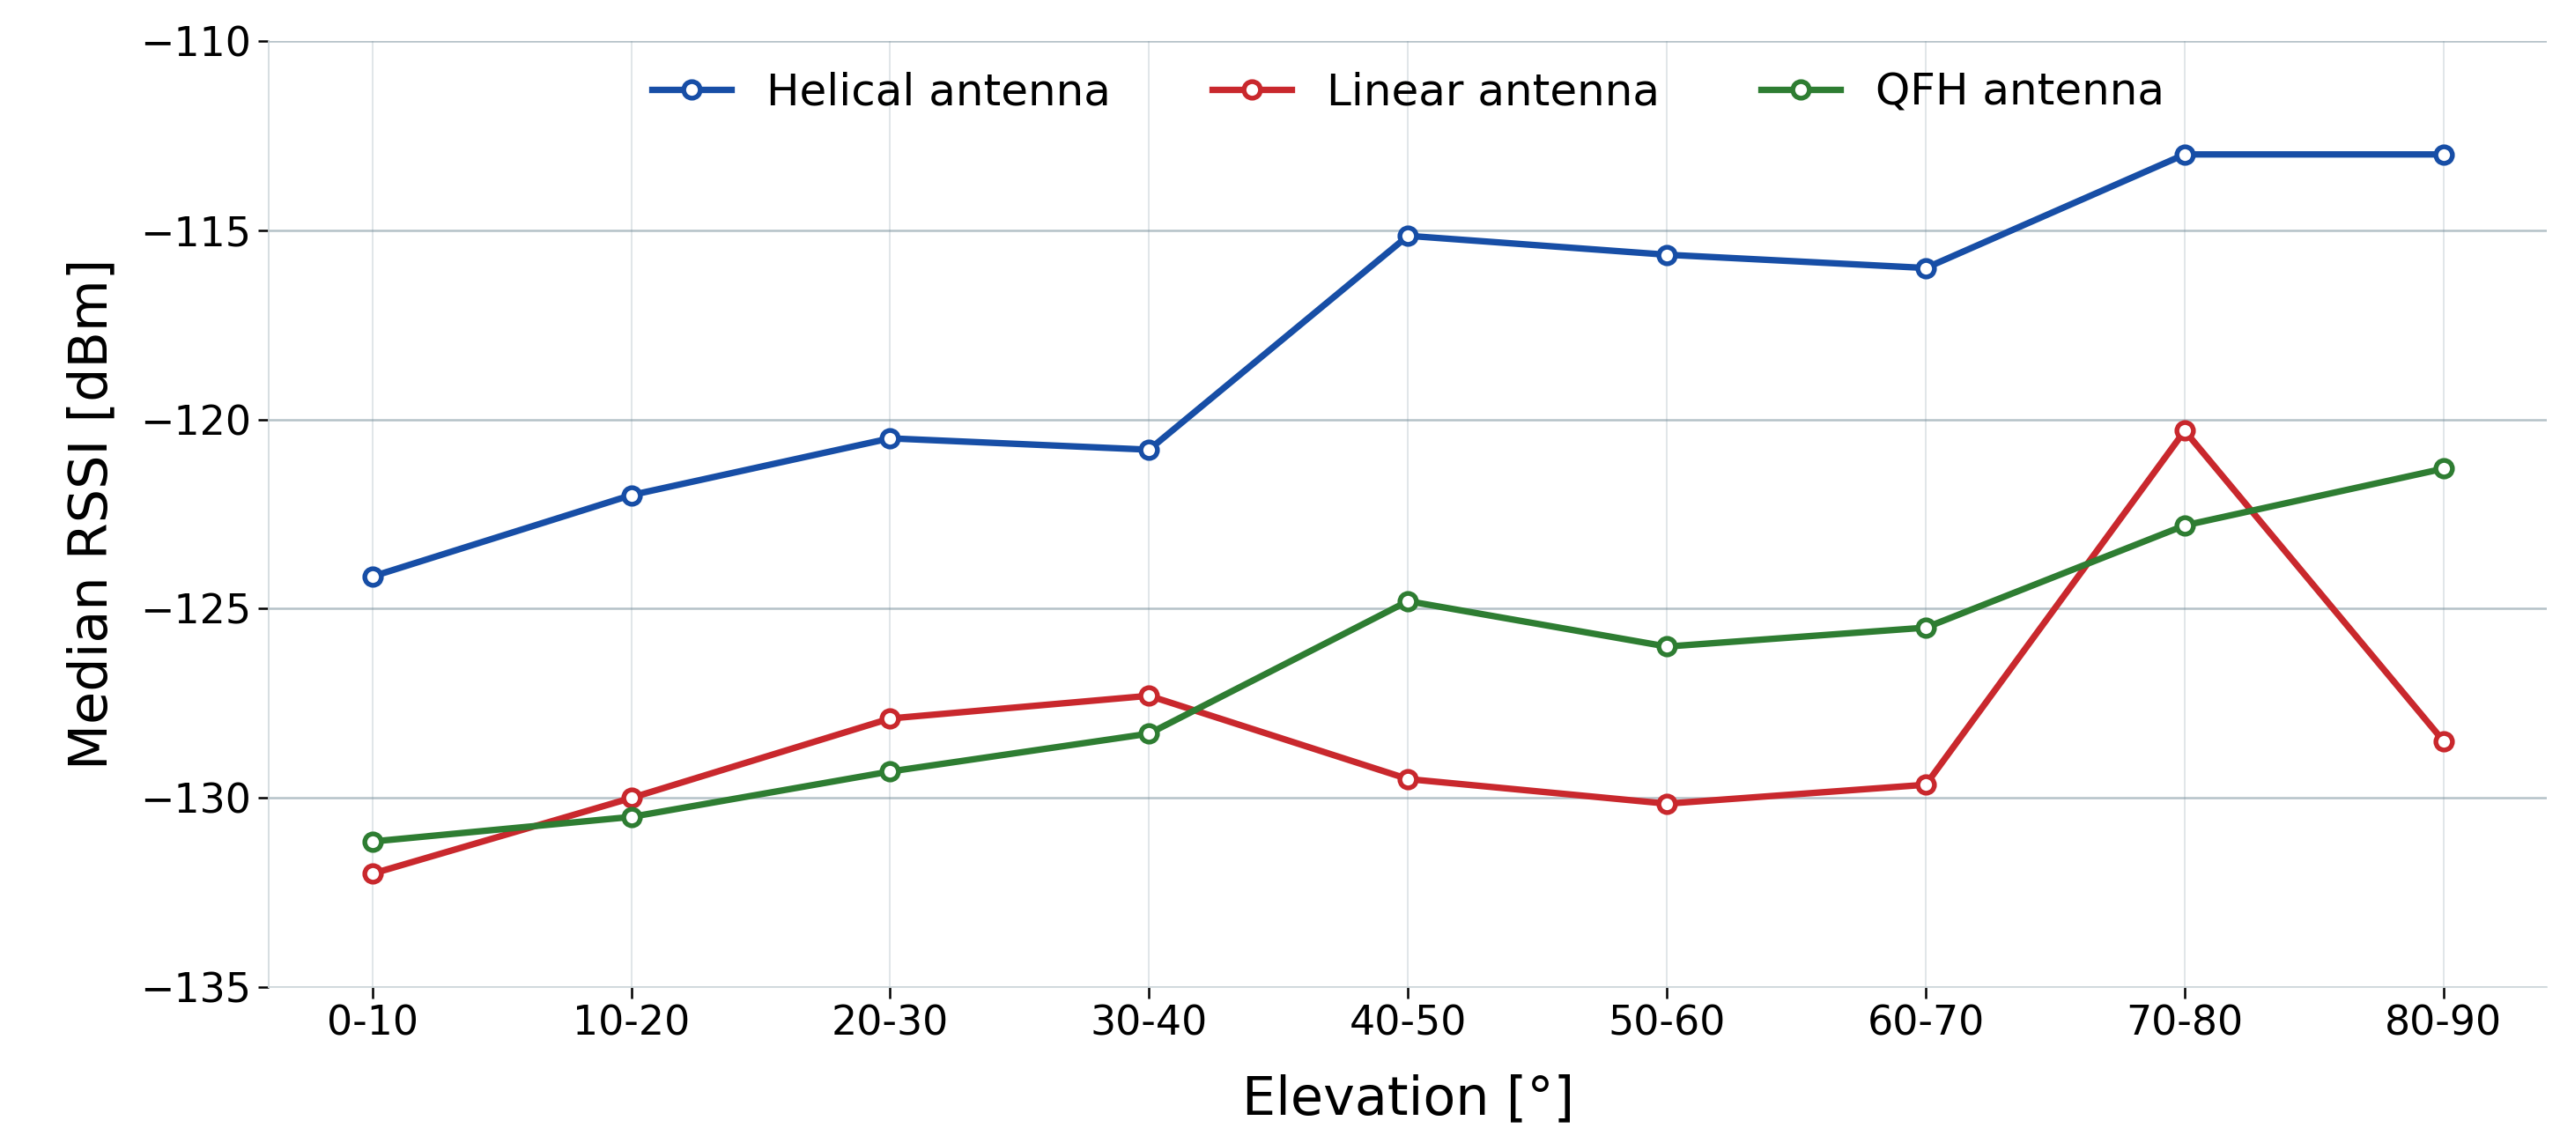
RSSI and SNR
From the point of view of signal quality, the tracked helical antenna performed best. At low elevation angles from 0 to 10 degrees, the median RSSI was approximately:
- Helical antenna: -124.15 dBm
- Linear whip antenna: -132.00 dBm
- QFH antenna: -131.15 dBm
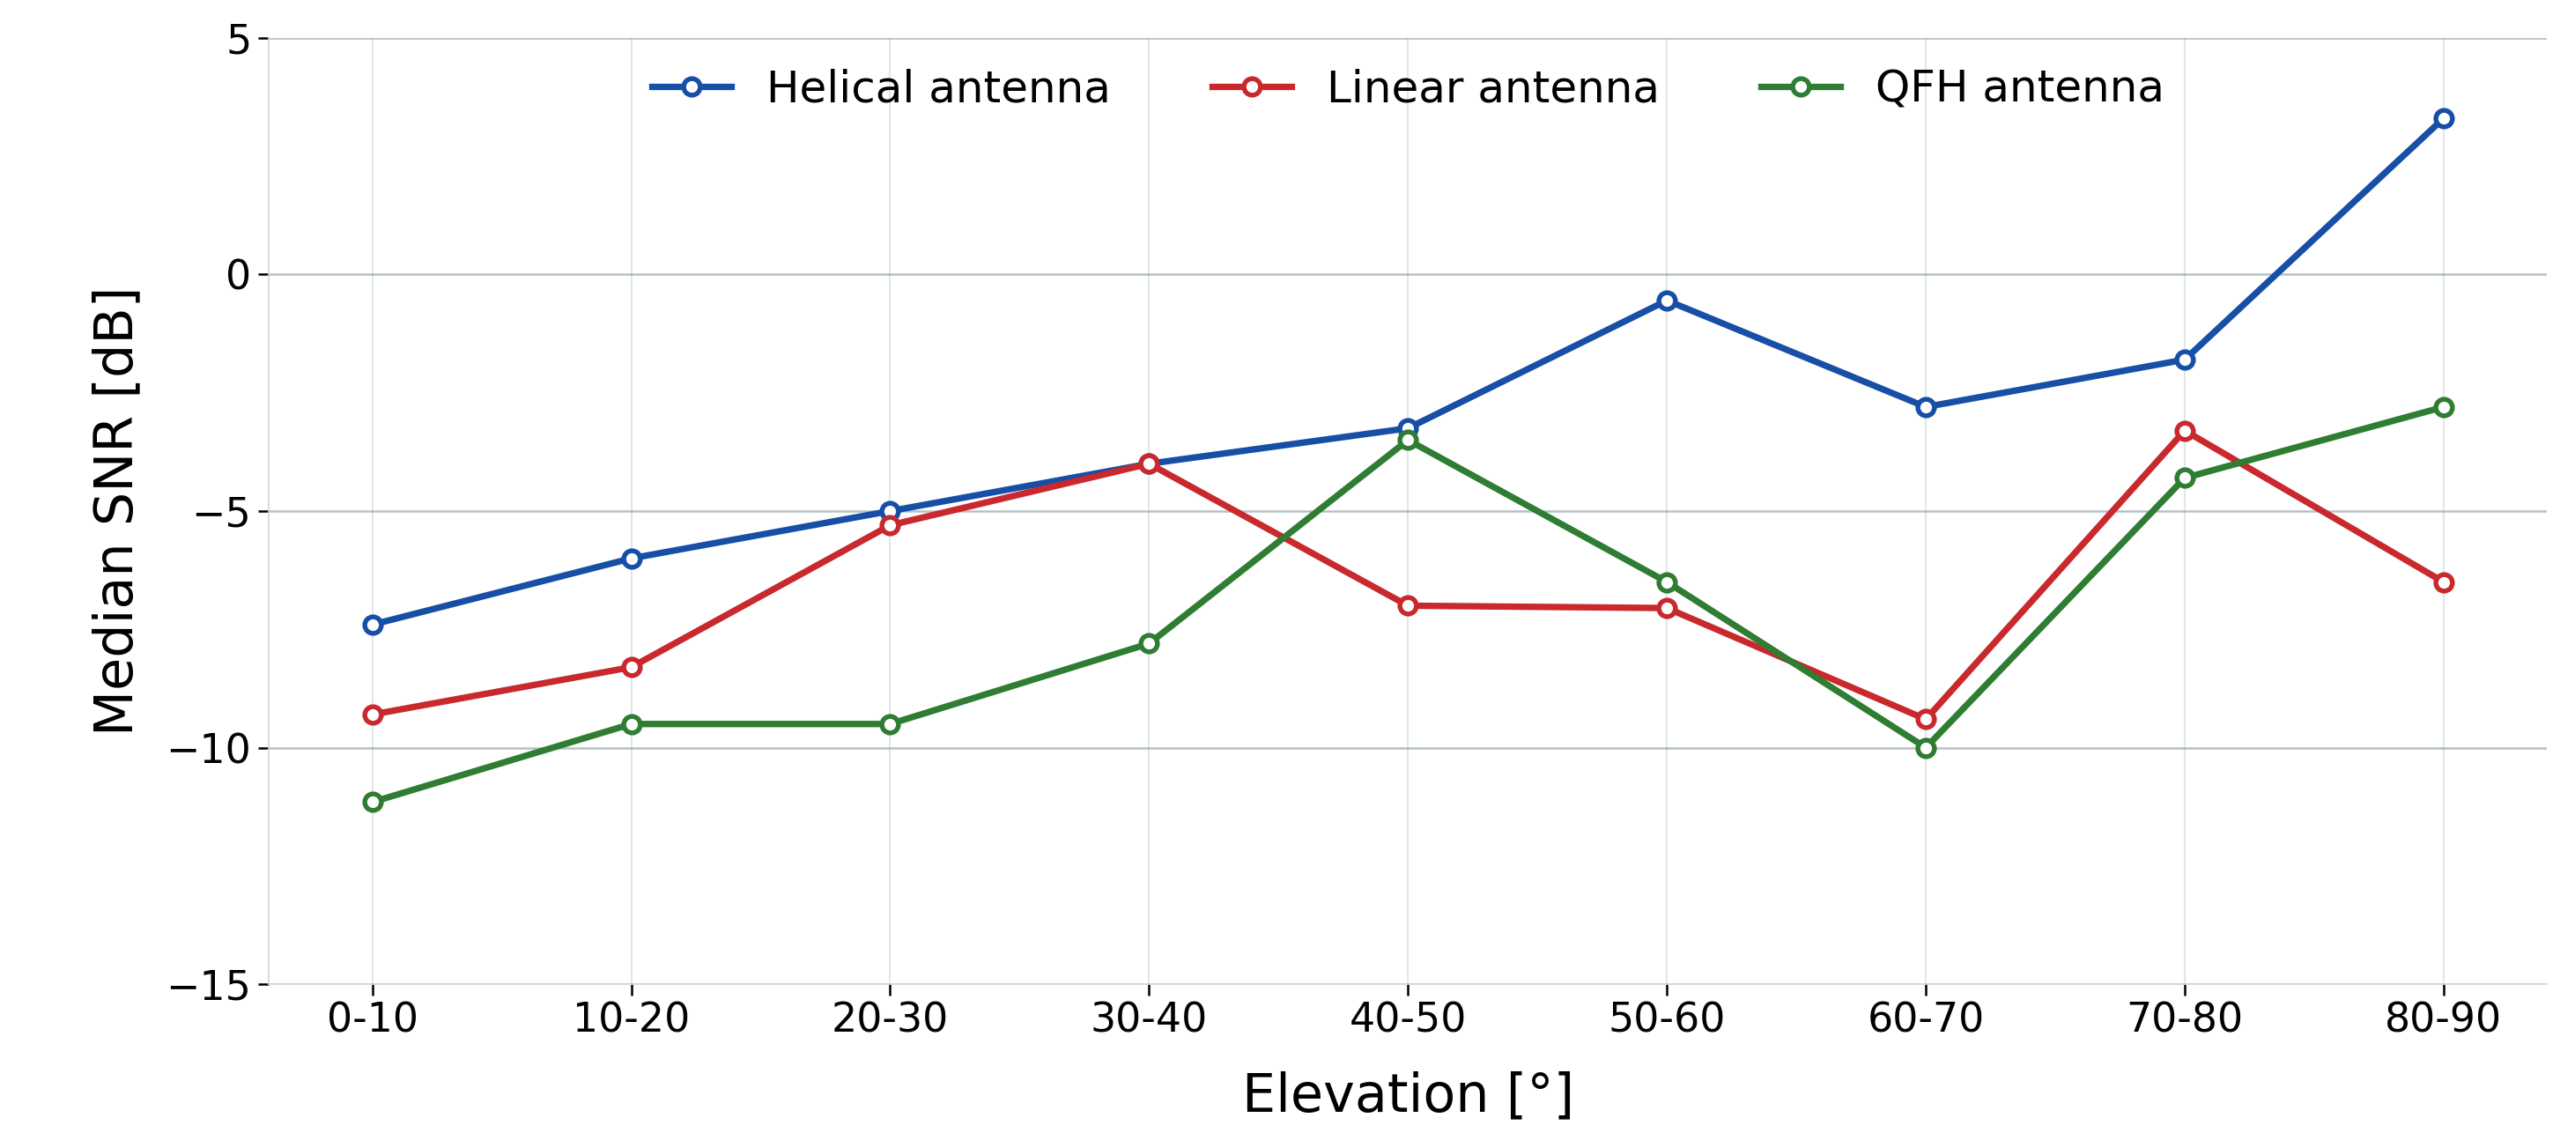
The same trend was visible in SNR. At 0 to 10 degrees elevation, the median SNR was approximately:
- Helical antenna: -7.40 dB
- Linear whip antenna: -9.30 dB
- QFH antenna: -11.15 dB
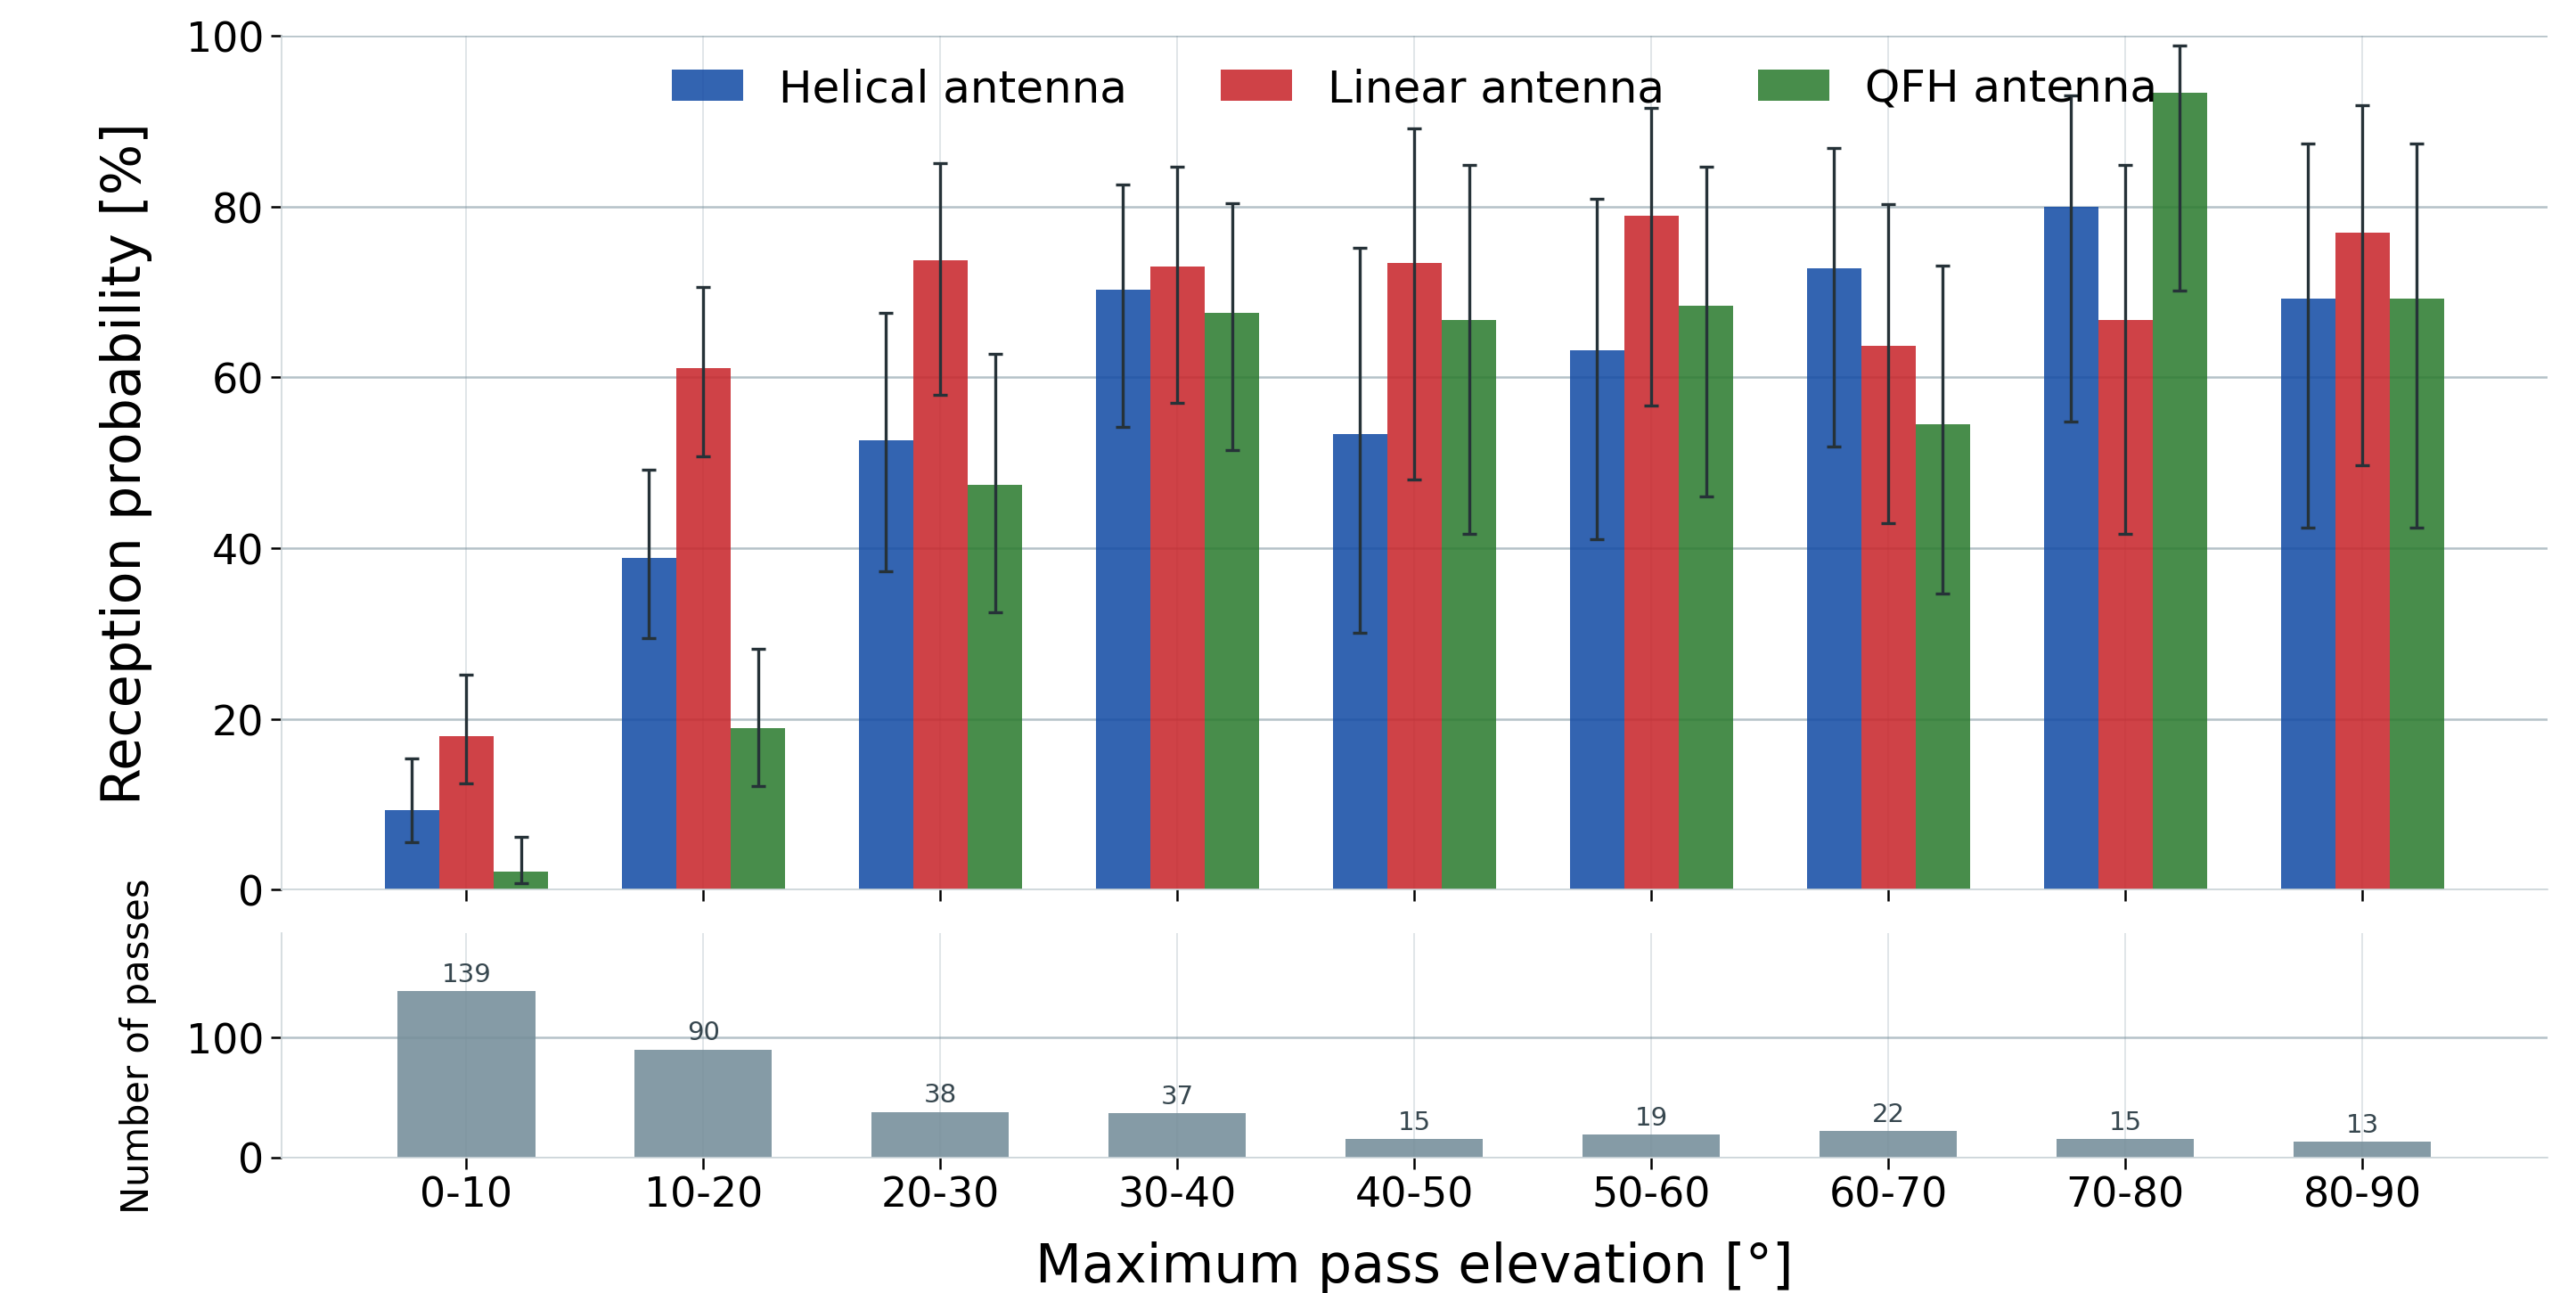
The result therefore has two parts. The directional helical antenna improved the quality of already received frames, but in this broad TinyGS operating scenario it did not produce the highest total number of frames or the highest overall pass reception probability.
Interpretation
The experiment shows that a higher-gain tracked antenna is not automatically the best choice for every TinyGS use case. It depends on what the station is expected to optimize:
- If the goal is to receive a specific satellite with known passes and suitable polarization, a tracked helical antenna is useful because it improves RSSI and SNR.
- If the goal is to collect as many frames as possible from many TinyGS satellites with changing targets, a simple passive antenna can be more robust in practice.
- Polarization and antenna elevation coverage matter, especially when comparing circularly and linearly polarized receiving antennas.
- The practical QFH result should not be generalized to all QFH antennas. The tested branch had only borderline matching near the working band and additional coaxial cable loss.
The main practical conclusion is that satellite LoRa reception is not determined only by peak antenna gain. Mechanical tracking delay, target switching, antenna elevation coverage, polarization uncertainty, cable losses and local reflections all influence the final reception success.
Limitations
The measurement was intentionally performed in real operating conditions, not in a perfectly controlled laboratory environment. The following limitations should be considered:
- The experiment lasted 48 hours, which is enough for a practical comparison but still limited.
- The TinyGS target set contained many satellites, so overlapping passes and target changes affected the tracked station.
- The antennas were designed and characterized mainly around 435 MHz, while a significant part of the traffic was around 400 MHz.
- The true polarization of all received satellites was not independently verified.
- The SynScan mount control did not provide independent position feedback to the software.
These limitations do not invalidate the experiment, but they are important when interpreting the results or when designing a follow-up measurement.
Source code and follow-up work
The software is published here:
https://github.com/MiraKnapovsky/SynScan-Satellite-Tracker-TinyGS
The repository includes:
- Python source code for TinyGS MQTT ingest and SynScan antenna tracking
- Configuration examples
- systemd service templates
- Grafana dashboard JSON files
- Documentation for installation and operation
This project builds on the public TinyGS ecosystem, especially the TinyGS firmware repository, its GitHub Wiki and the documented ground station configuration workflow.
A useful next experiment would limit the target set to a smaller number of satellites with known polarization and non-overlapping passes. That would make it easier to isolate the benefit of directional tracking from the effects of target switching and broad TinyGS network operation.